Amenities / Accessibility / Computed
Amenity Deprivation
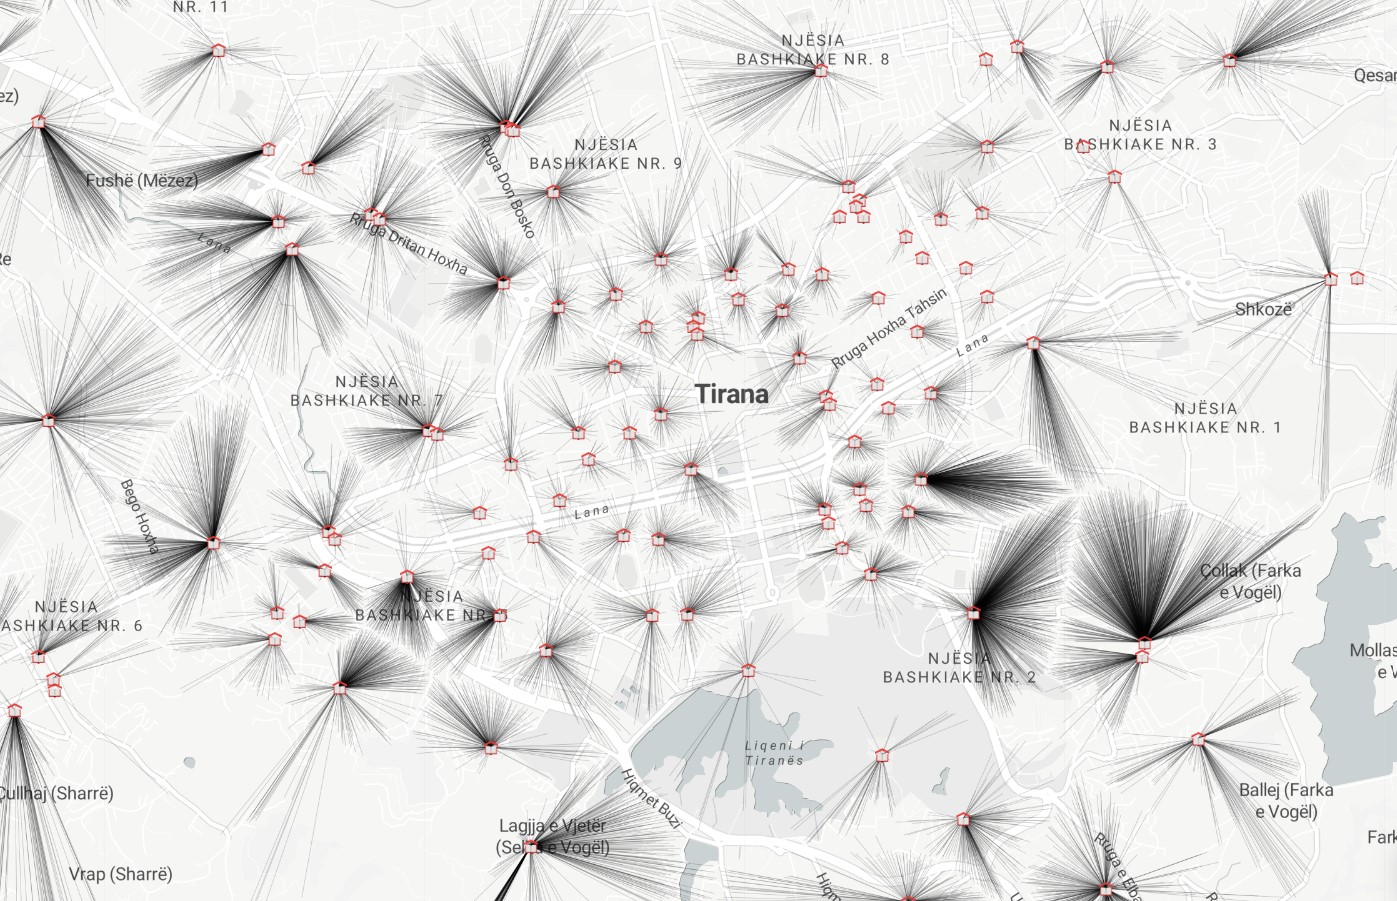
Custom beeline computation of all urban buildings connected with their closest school. Amenity deprivation analysis is a type of spatial analysis that is used to evaluate the availability of services and amenities in different areas, such as schools, hospitals, parks, and other public facilities. This analysis typically involves the use of geographic information systems (GIS) technology to create maps and spatial datasets that can be used to identify areas that may be deprived of certain amenities, and to understand the factors that contribute to amenity deprivation. This type of analysis can be used to support efforts to improve access to services and amenities, and to address inequalities in the distribution of resources and opportunities within a community. All amenities or a custom combination can be used to design a custom deprivation index. A non-exhaustive list of possible amenities includes: parking, fuel stations, taxi stations, supermarkets, convenience stores, postal offices, ATMs, money transfer offices, waste disposal bins, recycling bins, urban trash bins, benches, fountains, schools, universities, kindergartens, drinking water stations, courthouses, police stations, places of worship, community centers, shelters, pharmacies, clinics, hospitals. Full list: https://wiki.openstreetmap.org/wiki/Key:amenity
Metadata
Number
29
Availability
Available Now
Source
Layer
Original Source
Layer
Resolution
1m
Cadence
Live
Delivery Time
Days
Price
€200
Coverage
Global
Data Range
n/a
Commercial Use
Permitted - https://wiki.osmfoundation.org/wiki/Licence/Community_Guidelines/Produced_Work_-_Guideline
Sample Asset
/dataset-samples/amenity-deprivation.jpg
Created
7/30/2022 13:26
GIZ
Amenity Deprivation
EECU Seconds
-
Graph Data
Rank of longest segments / farthest LOS amenities from POI.
Rank of shortest segments / nearest LOS amenities from POI.
Research
No research note listed.
Local Sample
Schools.jpg