Layer registry
Datasets
Searchable catalogue generated from the full layer data sheet, with sample imagery served locally by the app.
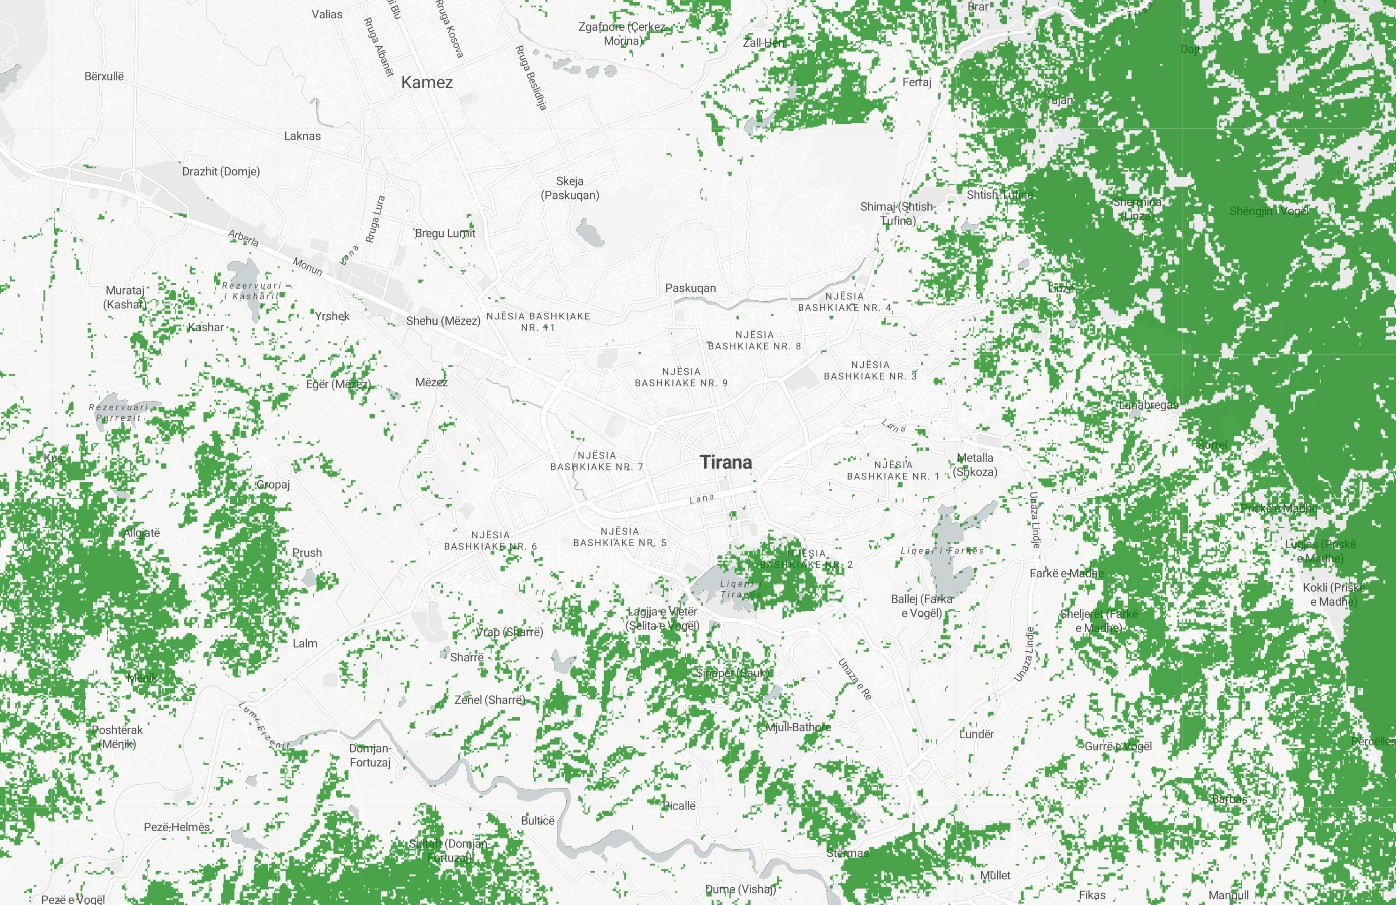
Forest Cover
Available NowSatellite derived remote sensed tree cover illustrating tree coverage at 10m resolution in 2020. Geospatially derived forest cover is a measure of forested area, as determined using geographic information systems (GIS) technology. This information can be obtained from various sources, such as satellite data.
Resolution
30.92m
Cadence
Solo
Delivery
Hours
Price
€100
Coverage
Global
Data Range
1/1/2000 - 1/1/2000
EECU Seconds
4
GIZ
Forest Cover
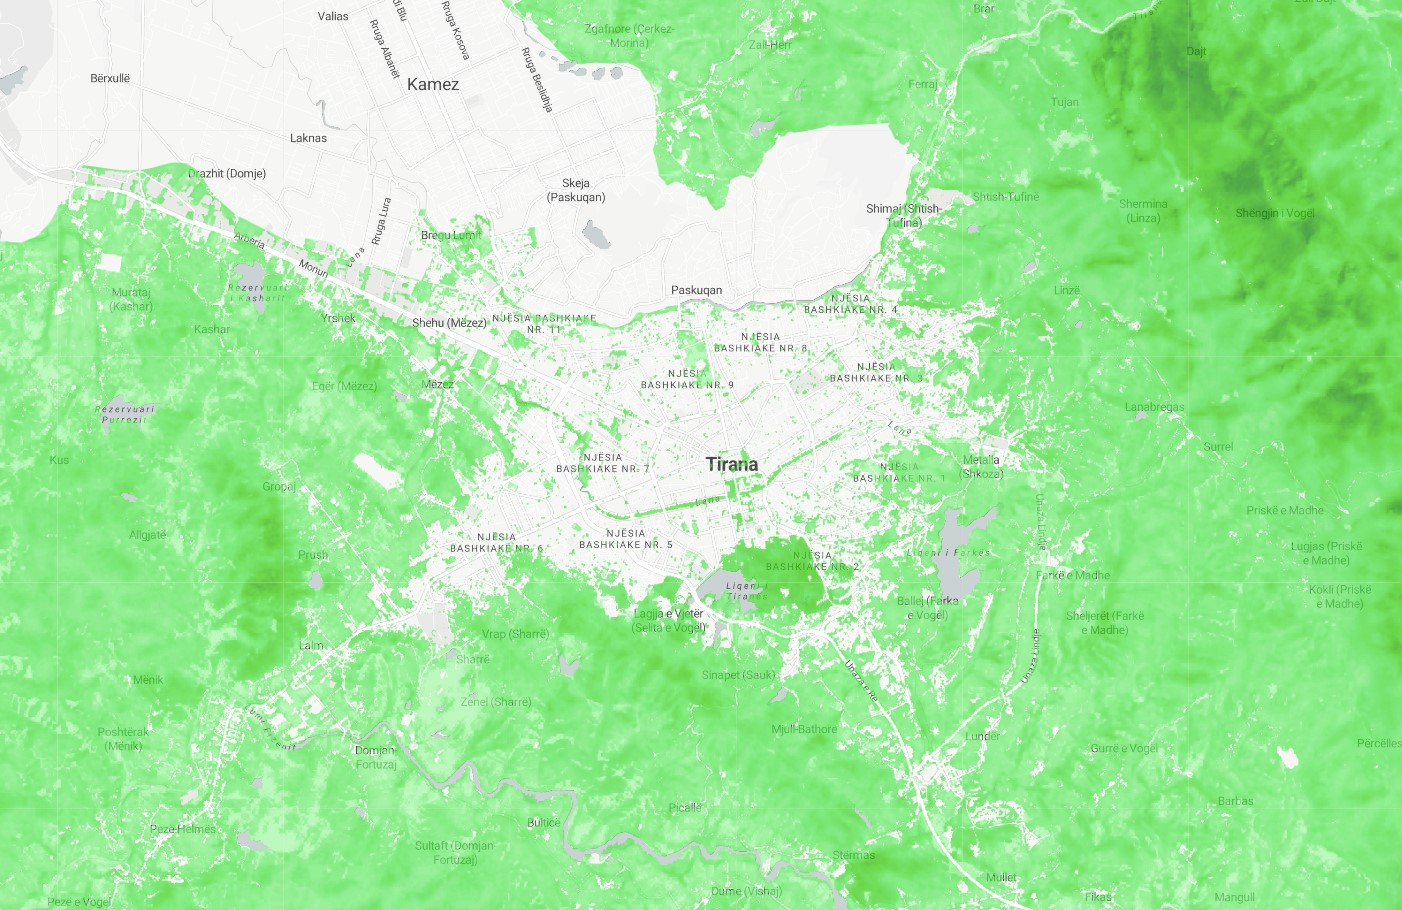
Forest Canopy Height
Available NowSatellite derived remote sensed tree canopy height computation illustrating estimated canopy height at 10m resolution in 2020. Geospatially derived forest canopy height is a measure of the average height of the trees in a forested area, as determined using geographic information systems (GIS) technology. This information can be obtained from various sources, such as satellite data. Forest canopy height is an important indicator of the health and productivity of a forest, and can provide valuable information for monitoring and managing forest resources.
Resolution
10m
Cadence
Solo
Delivery
Hours
Price
€100
Coverage
Global
Data Range
5/1/2020 - 11/1/2020
EECU Seconds
6
GIZ
Forest Canopy Height
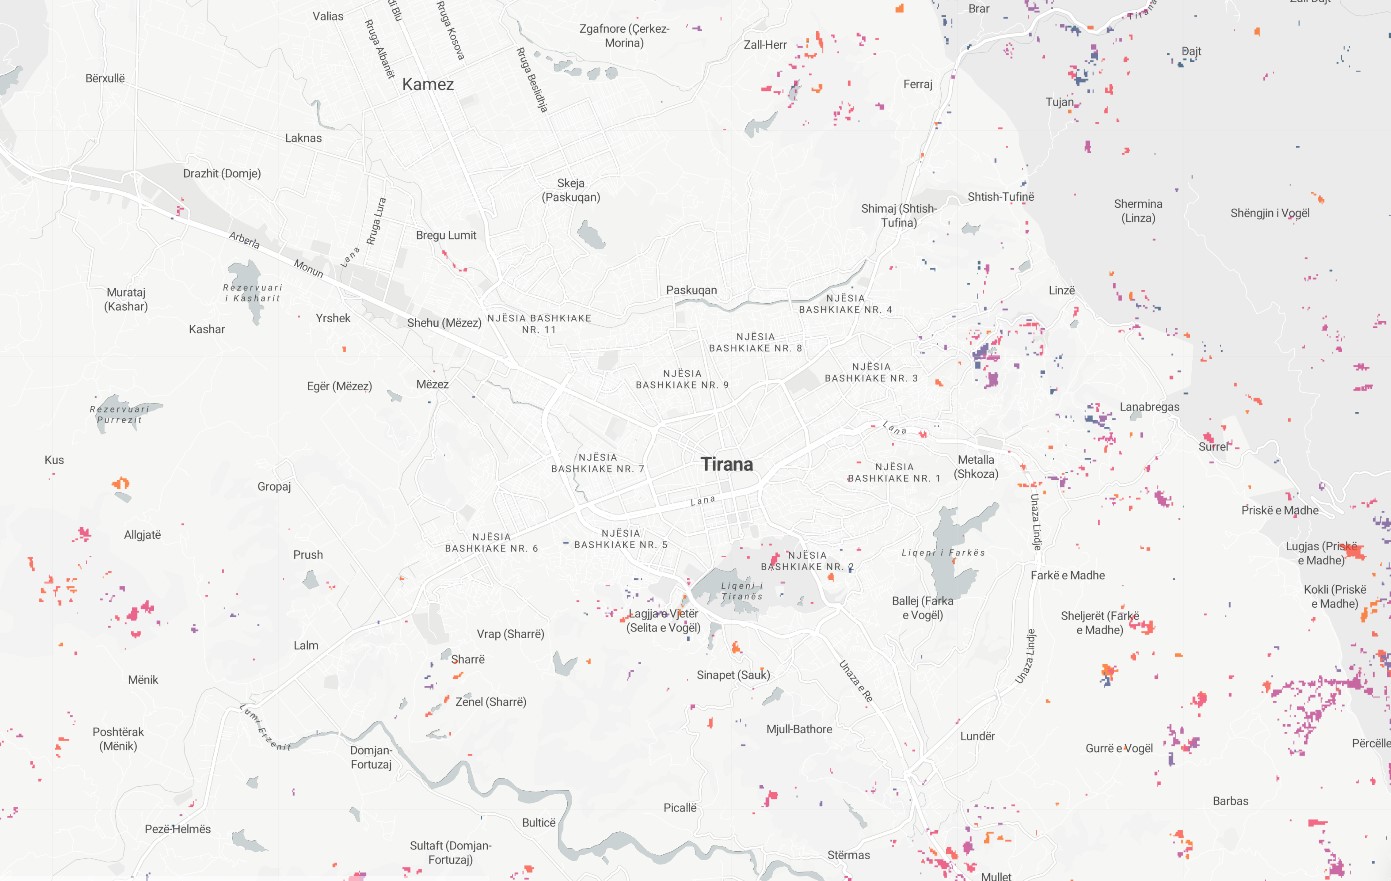
Forest Loss
Available NowComputation of Forest Cover Loss colored by year of loss: it illustrates satellite-derived difference in forest cover compared to 2020. Geospatially derived forest loss is the process of using geographic information systems (GIS) technology to identify and measure the loss of forest cover over time. This can be done by comparing different sets of spatial data, such as satellite imagery to identify changes in the extent of forested areas. Geospatially derived forest loss can provide important information about the causes and consequences of deforestation, and can be used to support efforts to conserve and manage forests more effectively.
Resolution
30.92m
Cadence
Yearly
Delivery
Hours
Price
€100
Coverage
Global
Data Range
1/1/2001 - 1/1/2021
EECU Seconds
4
GIZ
Forest Loss
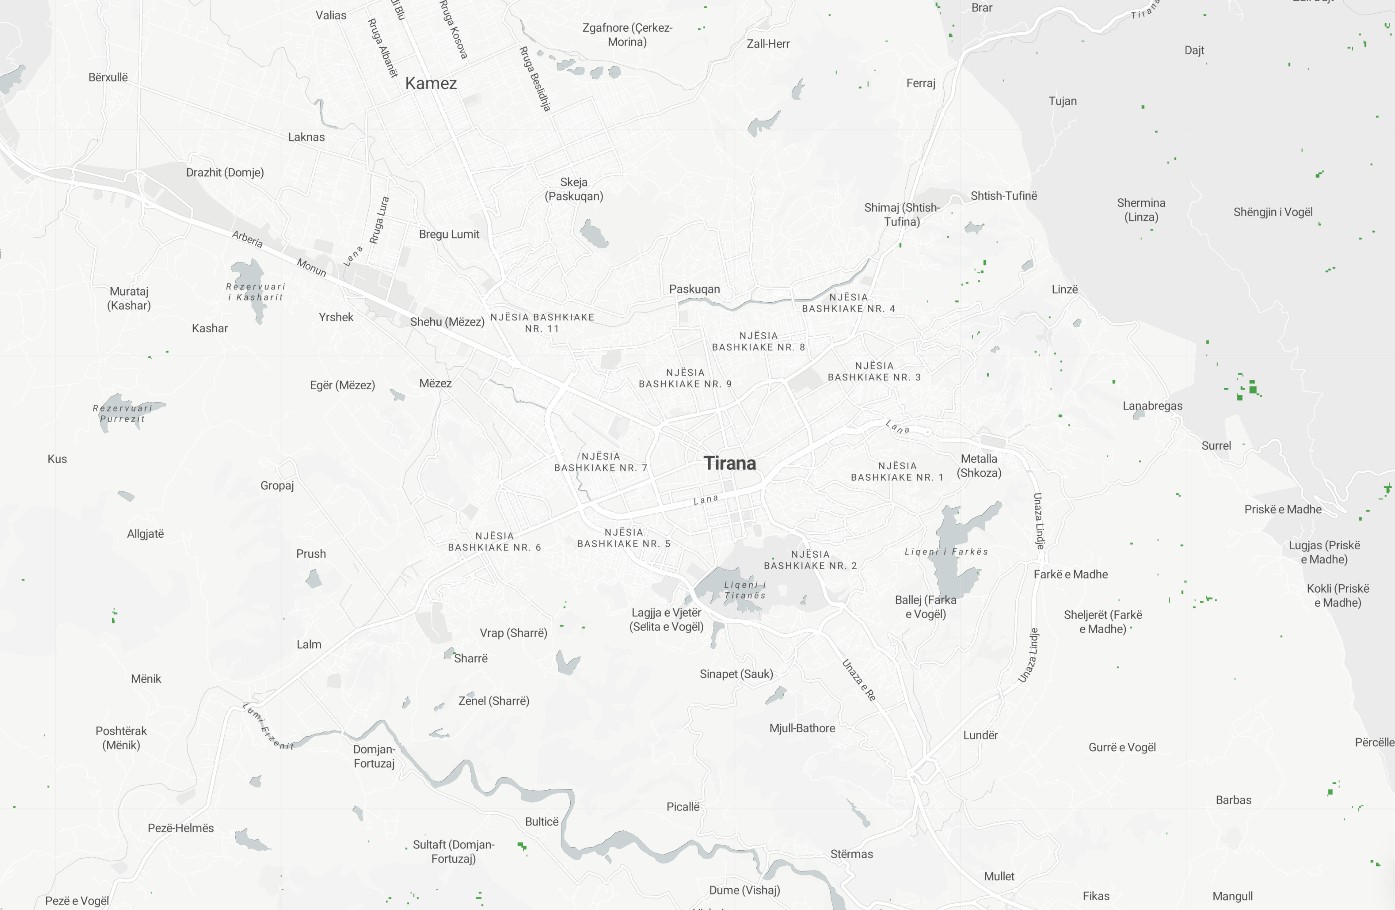
Forest Gain
Available NowComputation of Forest Cover Gain: this layer visualizes satellite-derived increase in forest cover in the year 2012 compared to forest cover in the year 2000. Geospatially derived forest gain is the process of using geographic information systems (GIS) technology to identify and measure increases in forest cover over time. This can be done by comparing different sets of spatial data, such as satellite imagery or aerial photographs, to identify changes in the extent of forested areas. Geospatially derived forest gain can provide important information about the success of reforestation efforts, and can be used to support efforts to conserve and manage forests more effectively.
Resolution
30.92m
Cadence
Solo
Delivery
Hours
Price
€100
Coverage
Global
Data Range
1/1/2000 - 1/1/2012
EECU Seconds
4
GIZ
Forest Gain
Land Surface Temperature
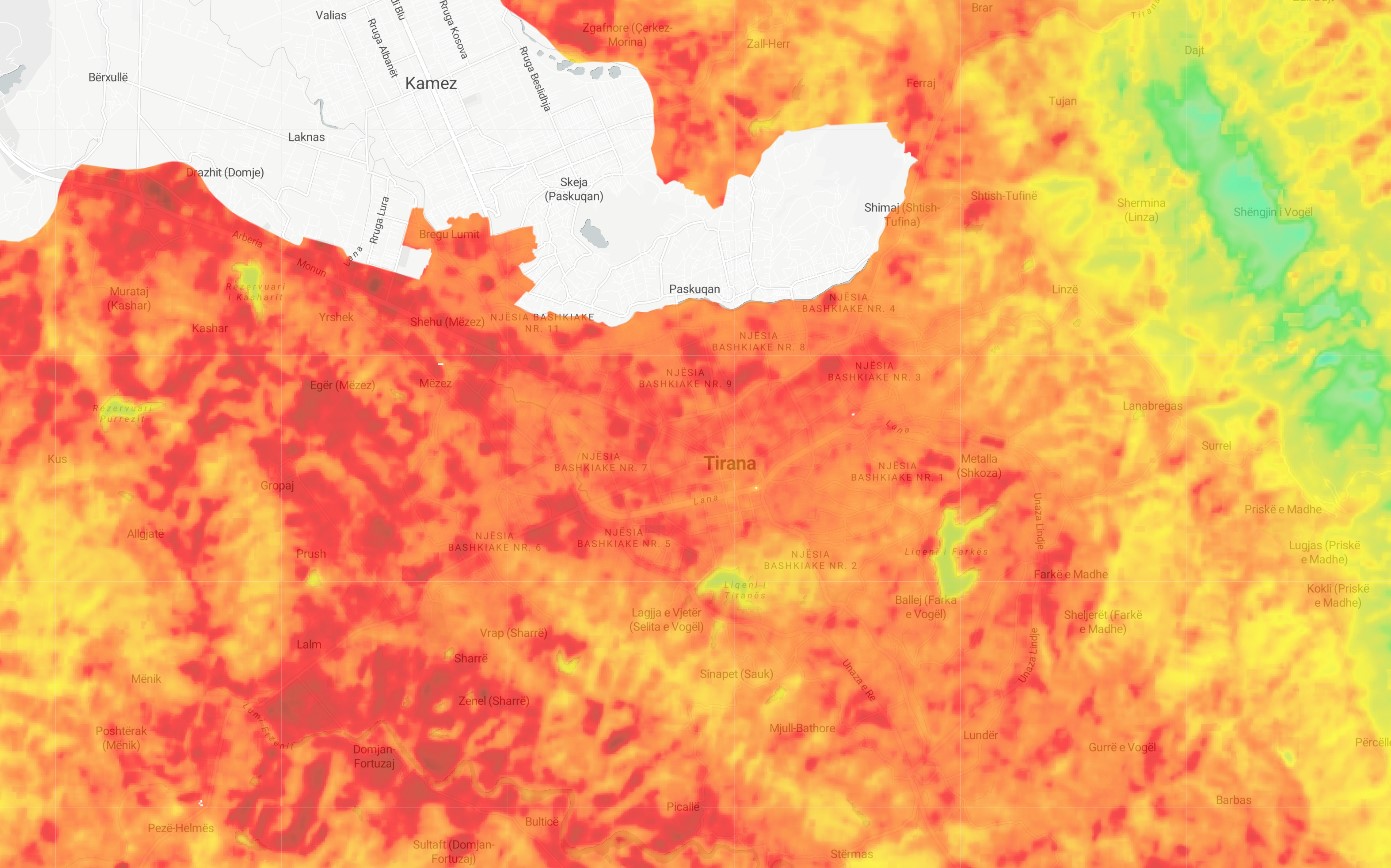
Available NowSatellite-derived weekly average land surface temperature as computed from Landsat (30m resolution) and MODIS (1Km resolution). Geospatially derived land surface temperature is a measure of the temperature of the Earth's surface at a particular location, as determined using geographic information systems (GIS) technology. This information is typically obtained from satellite-based sensors, which can detect the thermal radiation emitted by the land surface. Land surface temperature is an important indicator of the health and productivity of an ecosystem, and can provide valuable information for monitoring and managing land resources. It is also an important variable in climate modeling and can help to improve our understanding of the Earth's climate system.
Resolution
30m
Cadence
Weekly
Delivery
Hours
Price
€100
Coverage
Global
Data Range
3/18/2013 - 7/30/2022
EECU Seconds
178
GIZ
Land Surface Temperature
Precipitation and Rainfall
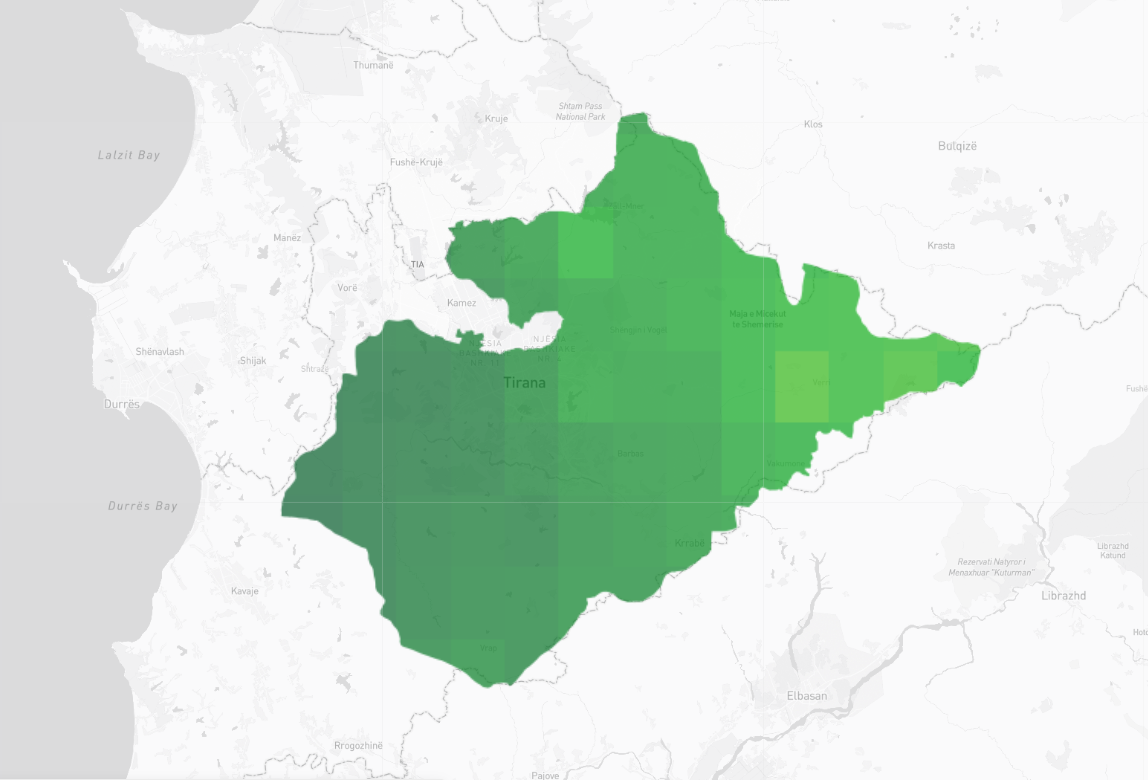
Available NowGlobal Satellite Mapping of Precipitation. A geospatially derived precipitation and rainfall map is a type of spatial dataset that represents the distribution of rainfall or precipitation over a given area. This type of map is typically created using geographic information systems (GIS) technology, and is based on data obtained from satellite observations. Precipitation and rainfall maps can provide valuable information for a wide range of purposes, such as for understanding the distribution of water resources, for studying the impacts of rainfall on the environment and local communities, or for supporting the planning and management of land resources.
Resolution
5566m
Cadence
Daily
Delivery
Hours
Price
€100
Coverage
Global
Data Range
1/1/1981 - 3/31/2023
EECU Seconds
1
GIZ
Precipitation and Rainfall
Population Density
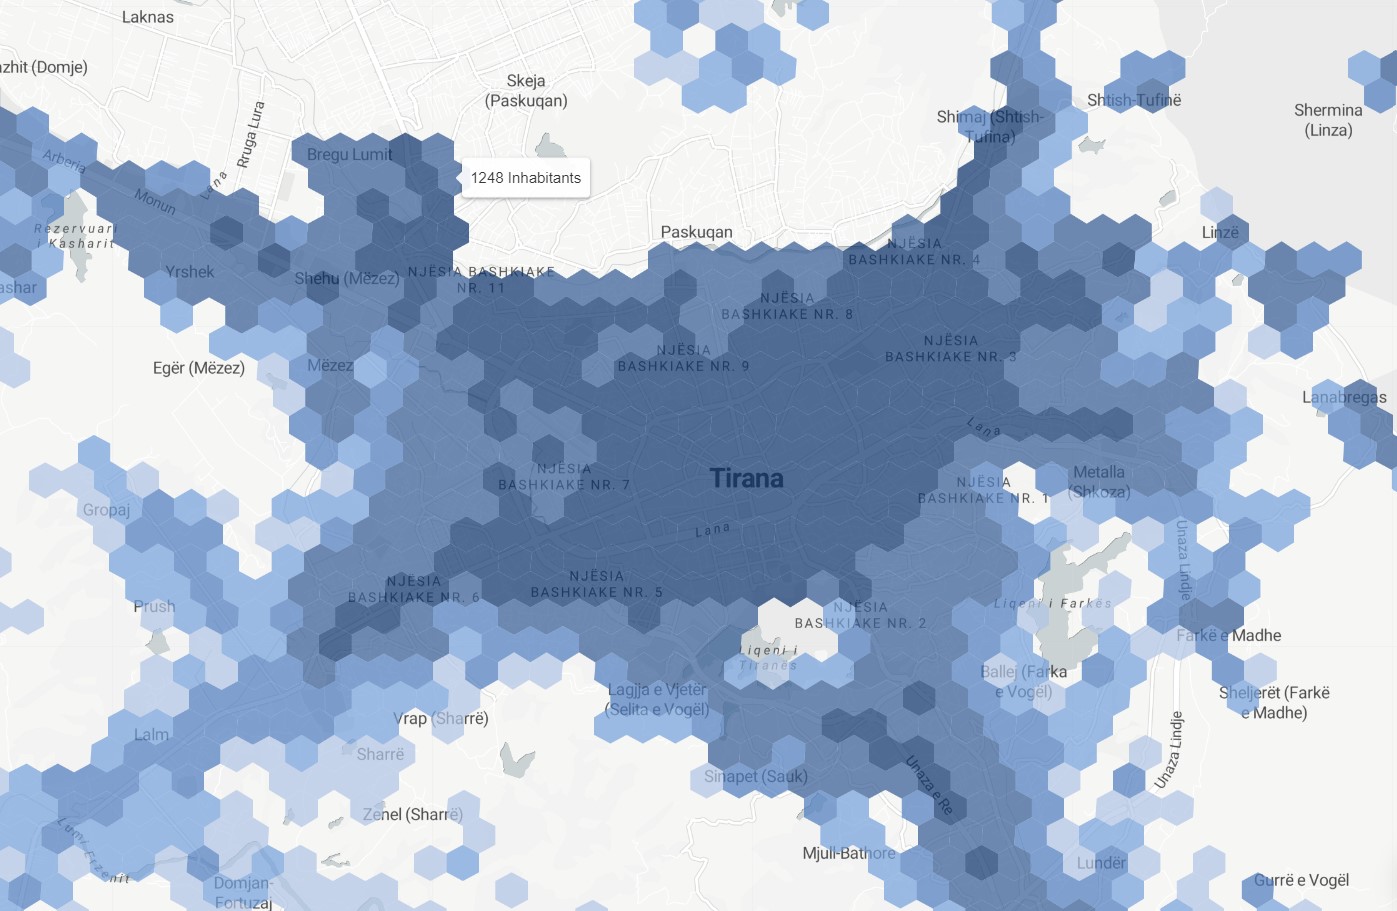
Available NowWorldpop crowdsourced & machine-learning derived population count estimations. Geospatially derived population counts spatial data analysis is a type of spatial analysis that is used to evaluate the distribution of population within a given area using geographic information systems technology. In this analysis, population counts obtained from satellite data are mapped to show the location and density of population within an area. This type of analysis can be used to identify areas of high or low population density, and to understand the factors that contribute to these patterns. The results of geospatially derived population counts spatial data analysis can be used to support planning and decision making, and to identify areas that may require additional resources or support to meet the needs of the population.
Resolution
100m
Cadence
Solo
Delivery
Days
Price
€200
Coverage
Global
Data Range
1/1/2020 - 12/31/2020
EECU Seconds
-
GIZ
Population Density
Nightlight Activity
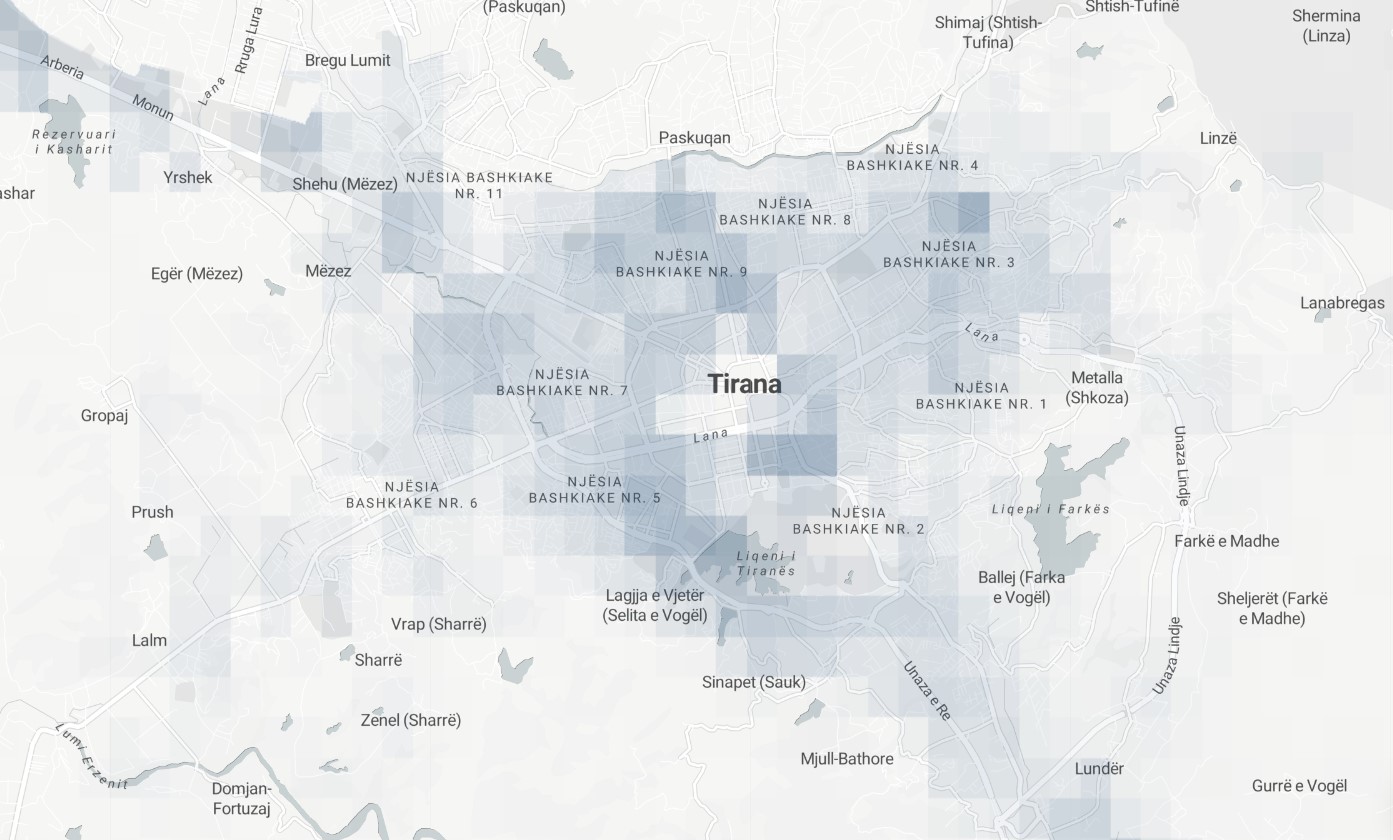
Available NowSatellite-derived nightlight activity change from 2014 to near real time. Geospatially derived nightlight change is a type of spatial analysis that is used to evaluate changes in the intensity of artificial light at night over time. In this analysis, satellite-based images of nightlight radiance are used to create maps and spatial datasets that can be compared to identify changes in the intensity of light at different locations. This type of analysis can be useful for a variety of purposes, such as for monitoring the growth and development of urban areas, for studying the impacts of light pollution on the environment and wildlife, high-resolution estimates of urban economic development or for supporting the planning and management of energy resources.
Resolution
463.83m
Cadence
Monthly
Delivery
Hours
Price
€100
Coverage
Global
Data Range
1/1/2014 - 6/1/2022
EECU Seconds
44
GIZ
Nightlight Activity
Historical World Settlement Footprint
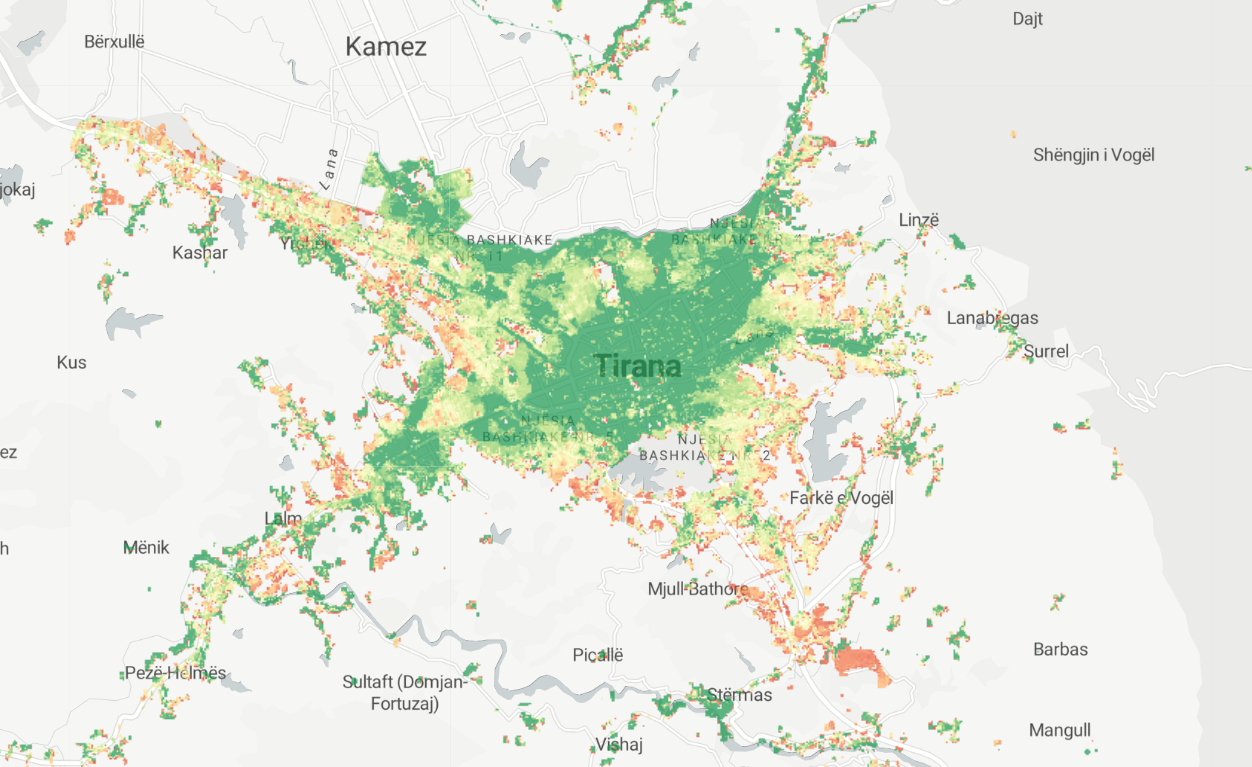
Available NowA comprehensive dataset of human settlements growth from 1985. Geospatially derived historical world settlement footprint is a type of spatial dataset that represents the distribution and growth of human settlements over time. This dataset is typically created using geographic information systems (GIS) technology, and is based on historical data about the location and extent of human settlements, such as cities, towns, and villages. The historical world settlement footprint dataset can provide valuable information for a wide range of purposes, such as for understanding the patterns and dynamics of urbanization, for studying the impacts of human settlements on the environment and local communities, or for supporting the planning and management of land resources.
Resolution
30m
Cadence
Yearly
Delivery
Hours
Price
€100
Coverage
Global
Data Range
1/1/1985 - 1/1/2019
EECU Seconds
10
GIZ
Historical World Settlement Footprint
Built Up 2030 Projection
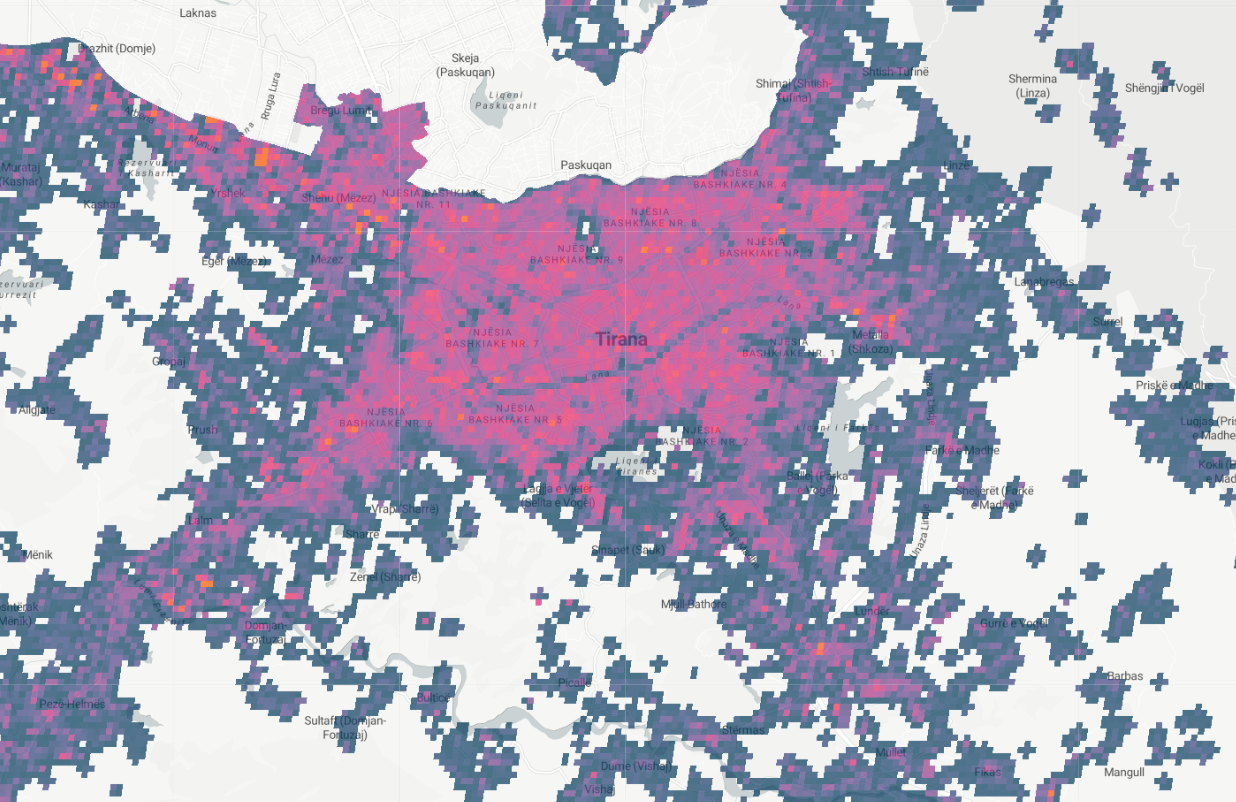
Available NowSatellite-derived Land Use / Land Cover estimation of built-up land in 2030 is a forecast or estimate of the extent of urbanization in a given area at a future point in time. This type of projection is often created using geographic information systems (GIS) technology, and is based on data about the current distribution and growth of urban areas, as well as on assumptions about future population growth, economic development, and other factors that may affect urbanization. Built-up land projections can provide valuable information for a variety of purposes, such as for supporting the planning and management of land resources, for studying the potential impacts of urbanization on the environment and local communities, or for understanding the dynamics of urban growth.
Resolution
38m
Cadence
Solo
Delivery
Hours
Price
€100
Coverage
Global
Data Range
1/1/1975 - 1/1/2030
EECU Seconds
13
GIZ
Built Up 2030 Projection
Built Up
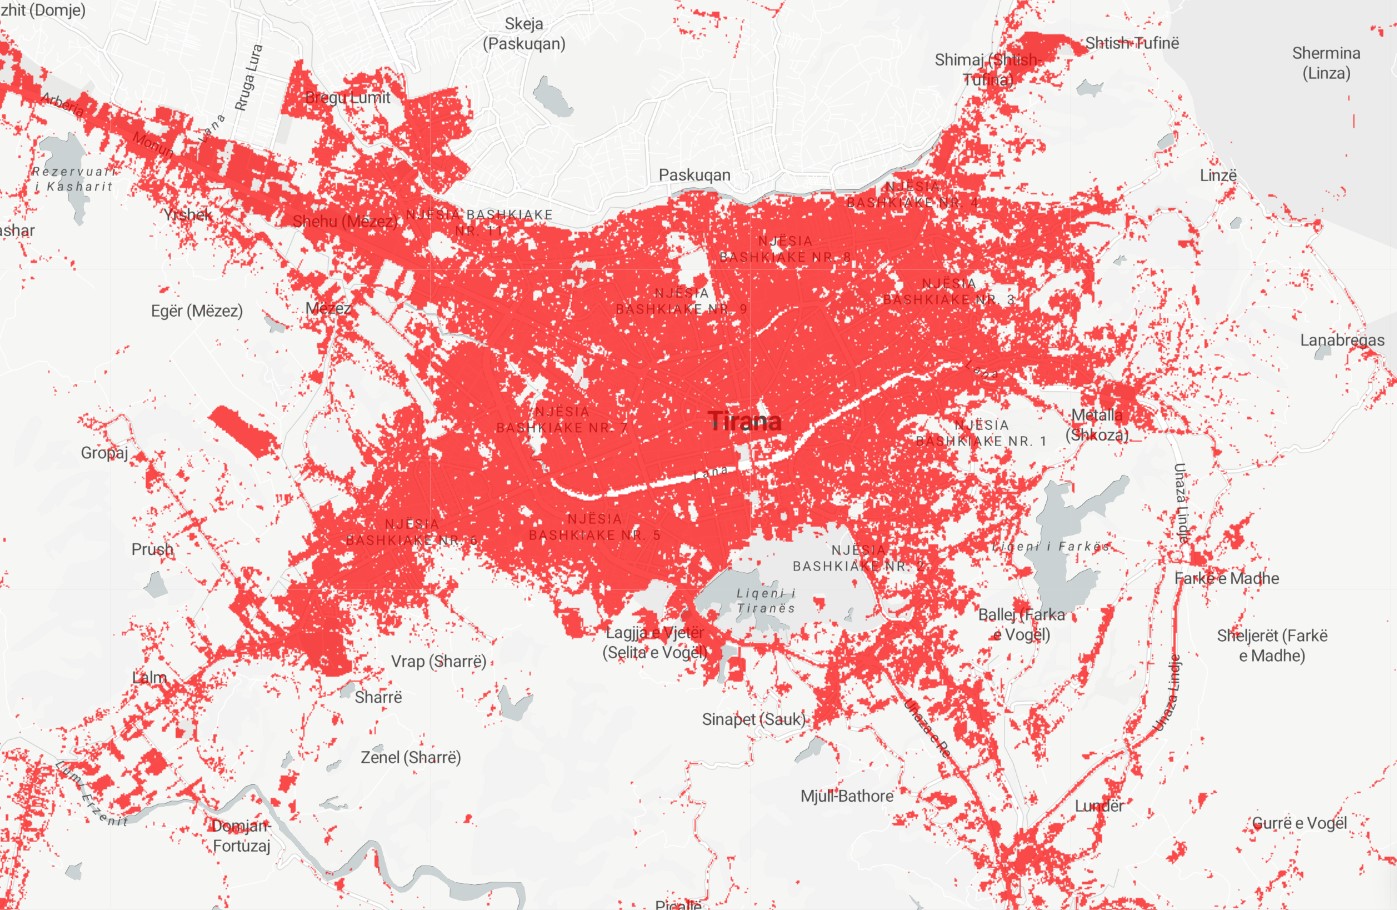
Available NowSatellite-derived Land Use / Land Cover computation of built-up land in 2020. Geospatially derived built-up land cover refers to information about areas of land that have been developed for human use, such as cities, towns, and other urban areas. This information is obtained using geographic information systems (GIS) technology, which allows for the creation of detailed maps and spatial datasets that can provide information about the location, extent, and characteristics of built-up areas. These datasets are often used by researchers, governments, and organizations to monitor and manage urban growth and development, and to understand the impacts of changes in land use on the environment and local communities.
Resolution
10m
Cadence
Solo
Delivery
Hours
Price
€100
Coverage
Global
Data Range
1/1/2020 - 1/1/2021
EECU Seconds
6
GIZ
Built Up
Building Volume
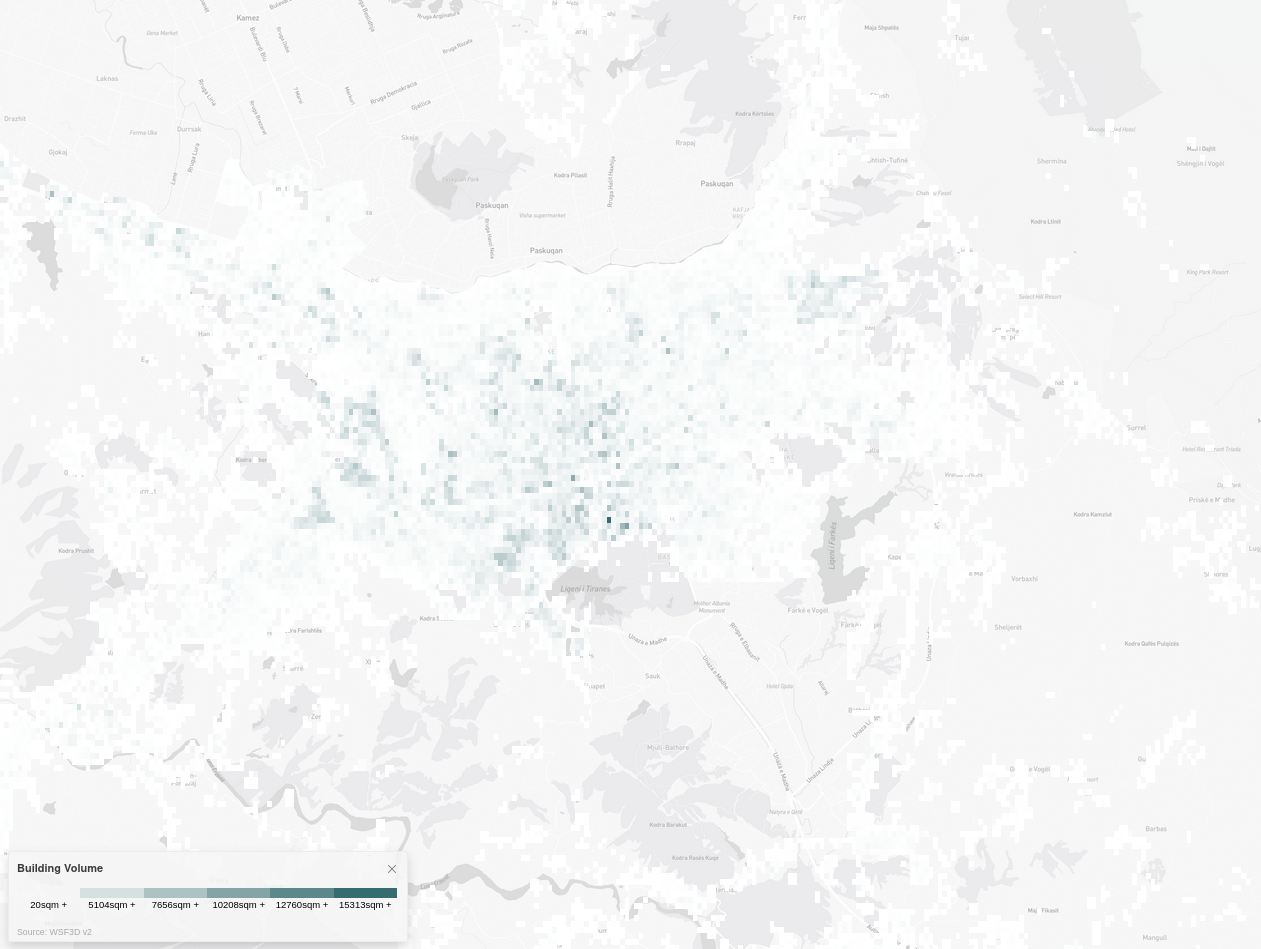
Available NowThe Building Volume data-set is mapped to settlements worldwide, which are defined as continuous areas of built-up structures. The data is generated through remote sensing, which involves using satellite imagery to collect information about the Earth's surface and is based on optical satellite imagery, which is processed using advanced image analysis techniques to extract information about building volume.
Resolution
90m
Cadence
Solo
Delivery
Hours
Price
€100
Coverage
Global
Data Range
1/1/2012 - 1/1/2012
EECU Seconds
13
GIZ
Building Volume
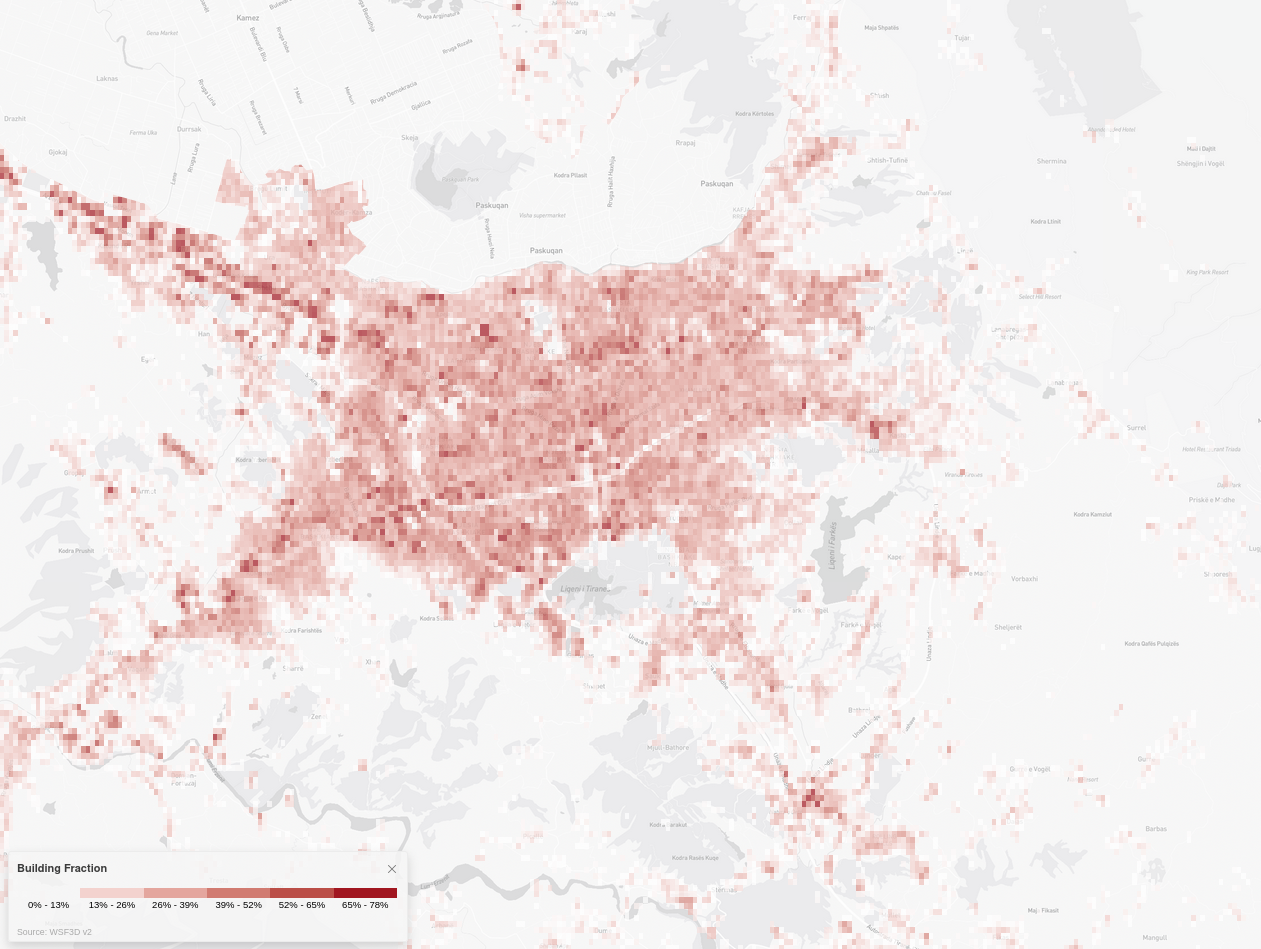
Building Fraction
Available NowThe Building Fraction data-set is mapped to settlements worldwide, which are defined as continuous areas of built-up structures. The data is generated through remote sensing, which involves using satellite imagery to collect information about the Earth's surface and is based on optical satellite imagery, which is processed using advanced image analysis techniques to extract information about building fraction.
Resolution
90m
Cadence
Solo
Delivery
Hours
Price
€100
Coverage
Global
Data Range
1/1/2019 - 1/1/2019
EECU Seconds
5
GIZ
Building Fraction
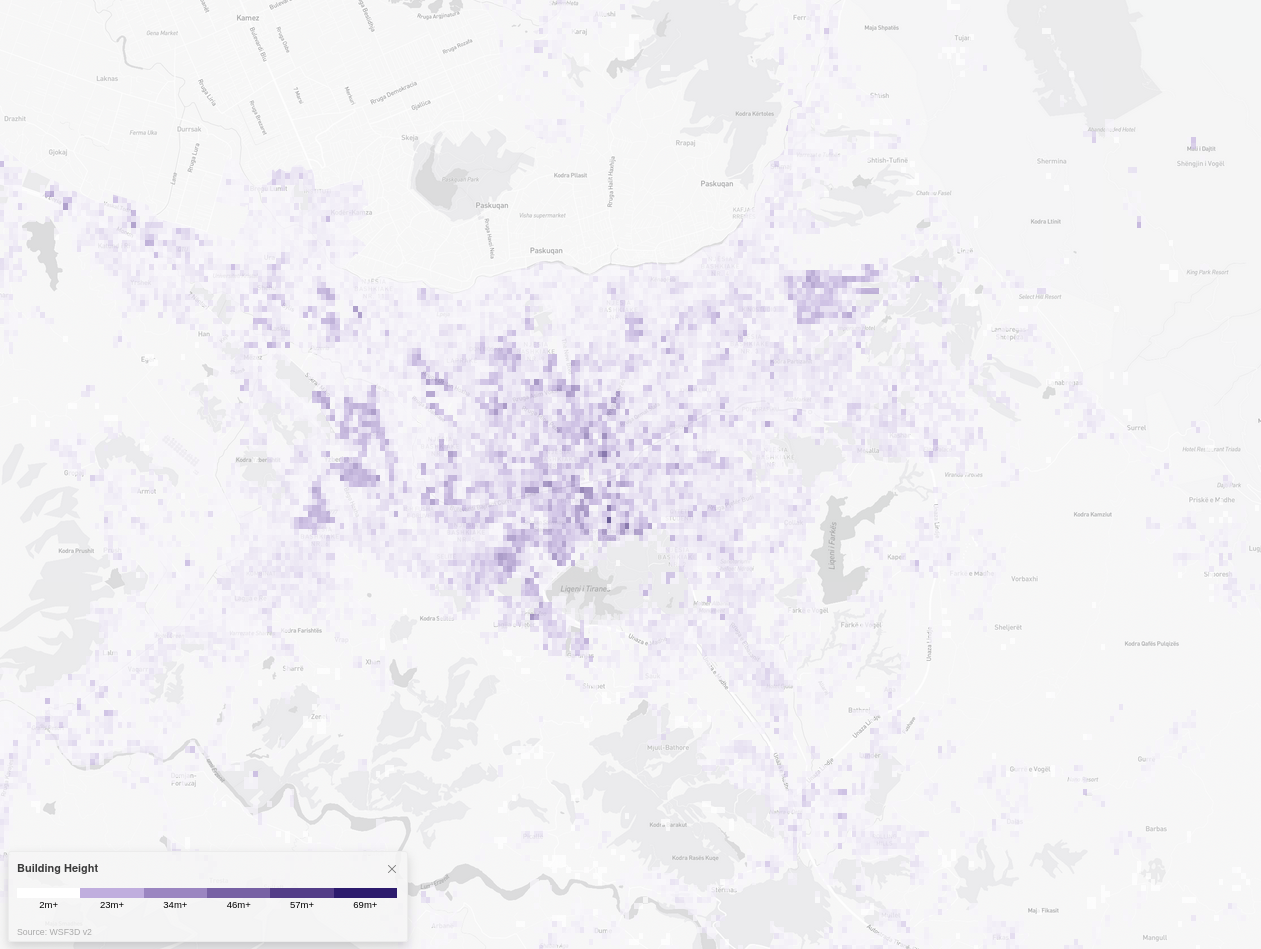
Building Height
Available NowThe Building Height data-set is mapped to settlements worldwide, which are defined as continuous areas of built-up structures. The data is generated through remote sensing, which involves using satellite imagery to collect information about the Earth's surface and is based on optical satellite imagery, which is processed using advanced image analysis techniques to extract information about building height.
Resolution
90m
Cadence
Solo
Delivery
Hours
Price
€100
Coverage
Global
Data Range
1/1/2012 - 1/1/2012
EECU Seconds
3
GIZ
Building Height
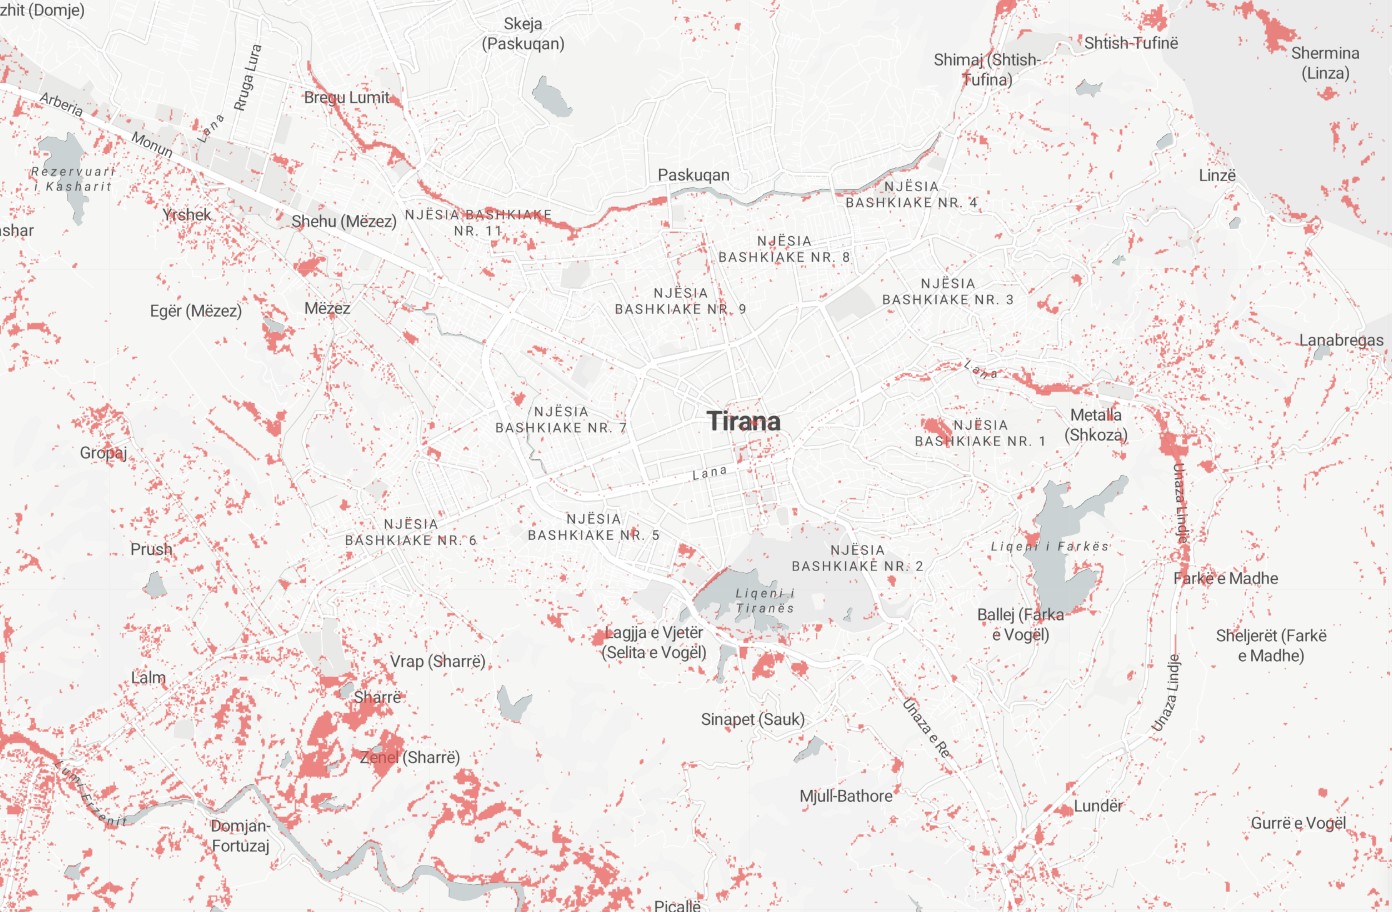
Barren and Sparse Vegetation
Available NowSatellite-derived Land Use / Land Cover computation of barren and sparse vegetation land in 2020. Geospatially derived barren and sparse vegetation land cover refers to information about areas of land that have very little vegetation, such as deserts, rocky outcrops, or other areas where vegetation is scarce. This information is obtained using geographic information systems (GIS) technology, which allows for the creation of detailed maps and spatial datasets that can provide information about the location, extent, and characteristics of these types of land cover. These datasets are often used by researchers, governments, and organizations to monitor and manage land use and resources, and to understand the impacts of changes in land cover on the environment and local communities.
Resolution
10m
Cadence
Solo
Delivery
Hours
Price
€100
Coverage
Global
Data Range
1/1/2020 - 1/1/2021
EECU Seconds
24
GIZ
Barren and Sparse Vegetation
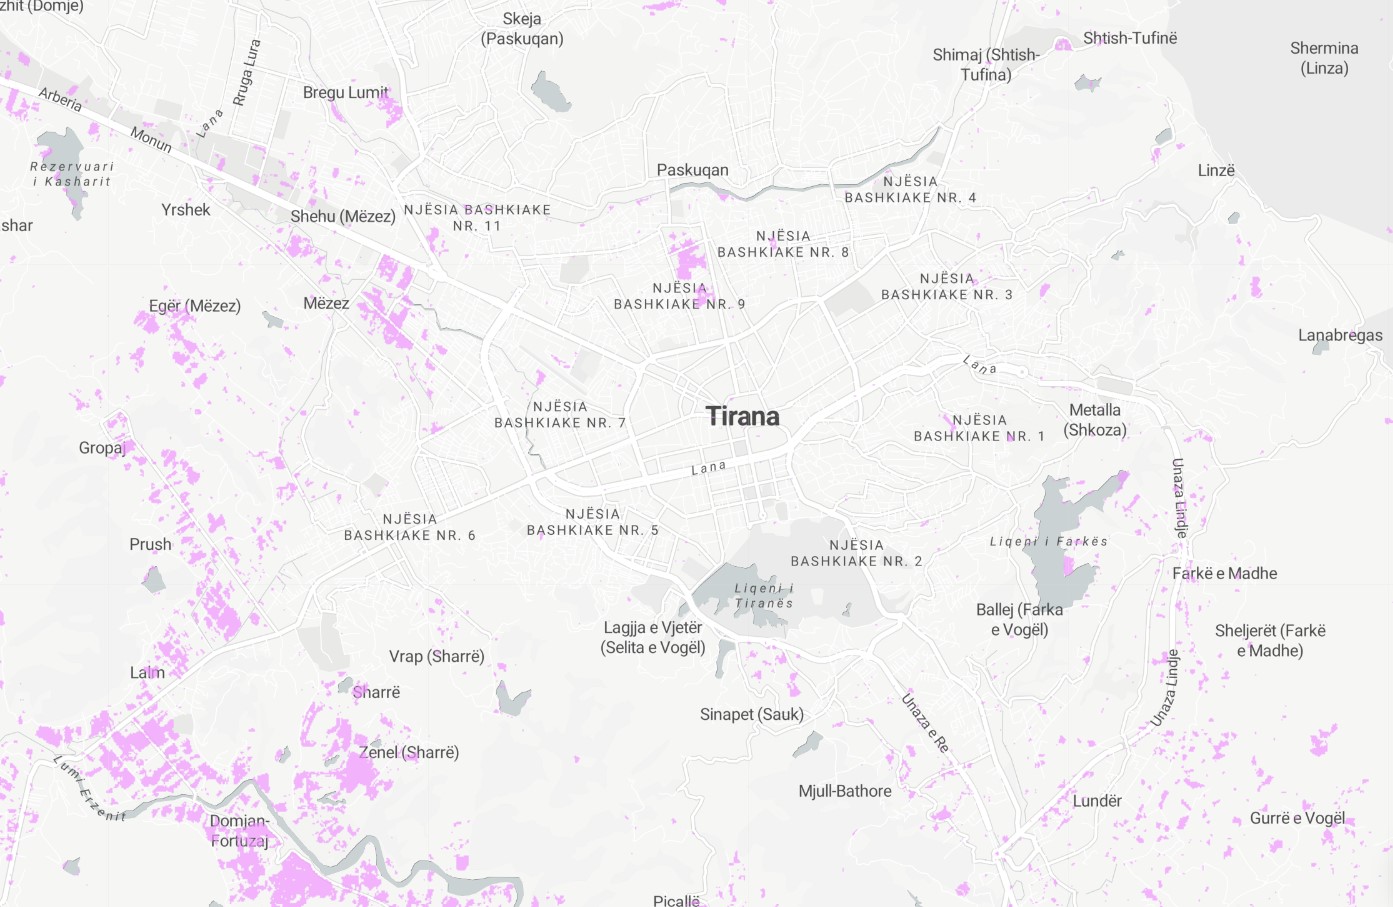
Cropland
Available NowSatellite-derived Land Use / Land Cover computation of cropland in 2020. Geospatially derived cropland cover refers to information about areas of land that are used for growing crops, such as fields of wheat, corn, or other crops. This information is obtained using geographic information systems (GIS) technology, which allows for the creation of detailed maps and spatial datasets that can provide information about the location, extent, and characteristics of cropland. These datasets are often used by researchers, governments, and organizations to monitor and manage agricultural production and land use, and to understand the impacts of changes in cropland on the environment and local communities.
Resolution
10m
Cadence
Solo
Delivery
Hours
Price
€100
Coverage
Global
Data Range
1/1/2020 - 1/1/2021
EECU Seconds
22
GIZ
Cropland
Open Water
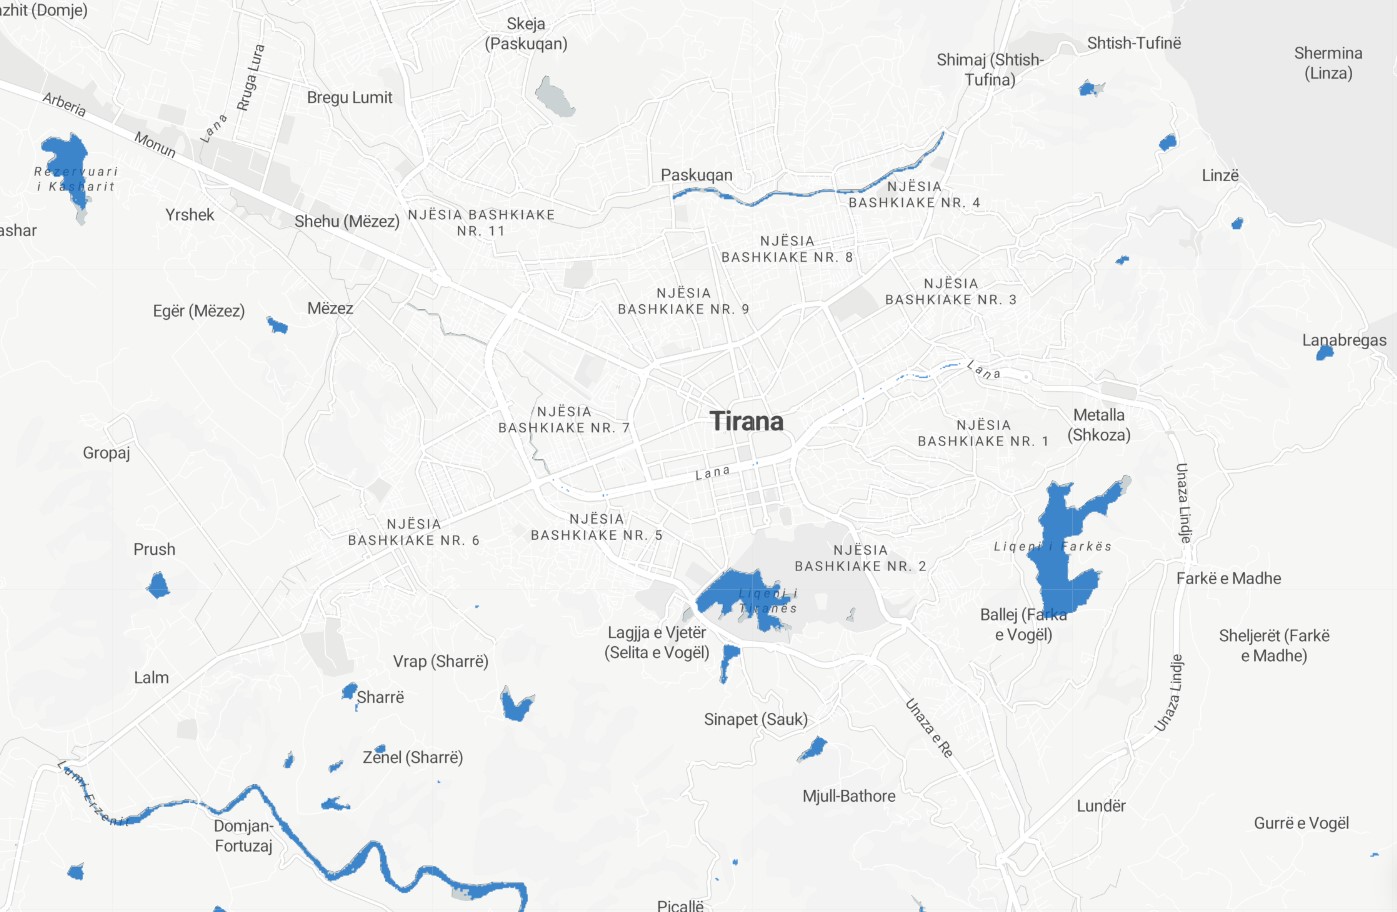
Available NowSatellite-derived Land Use / Land Cover computation of open water bodies in 2020. Geospatially derived open water land cover refers to information about areas of land that are covered by water, such as lakes, rivers, and other bodies of water. This information is obtained using geographic information systems (GIS) technology, which allows for the creation of detailed maps and spatial datasets that can provide information about the location, extent, and characteristics of open water. These datasets are often used by researchers, governments, and organizations to monitor and manage water resources, and to understand the impacts of changes in water cover on the environment and local communities.
Resolution
10m
Cadence
Solo
Delivery
Hours
Price
€100
Coverage
Global
Data Range
1/1/2020 - 1/1/2021
EECU Seconds
37
GIZ
Open Water
Trees
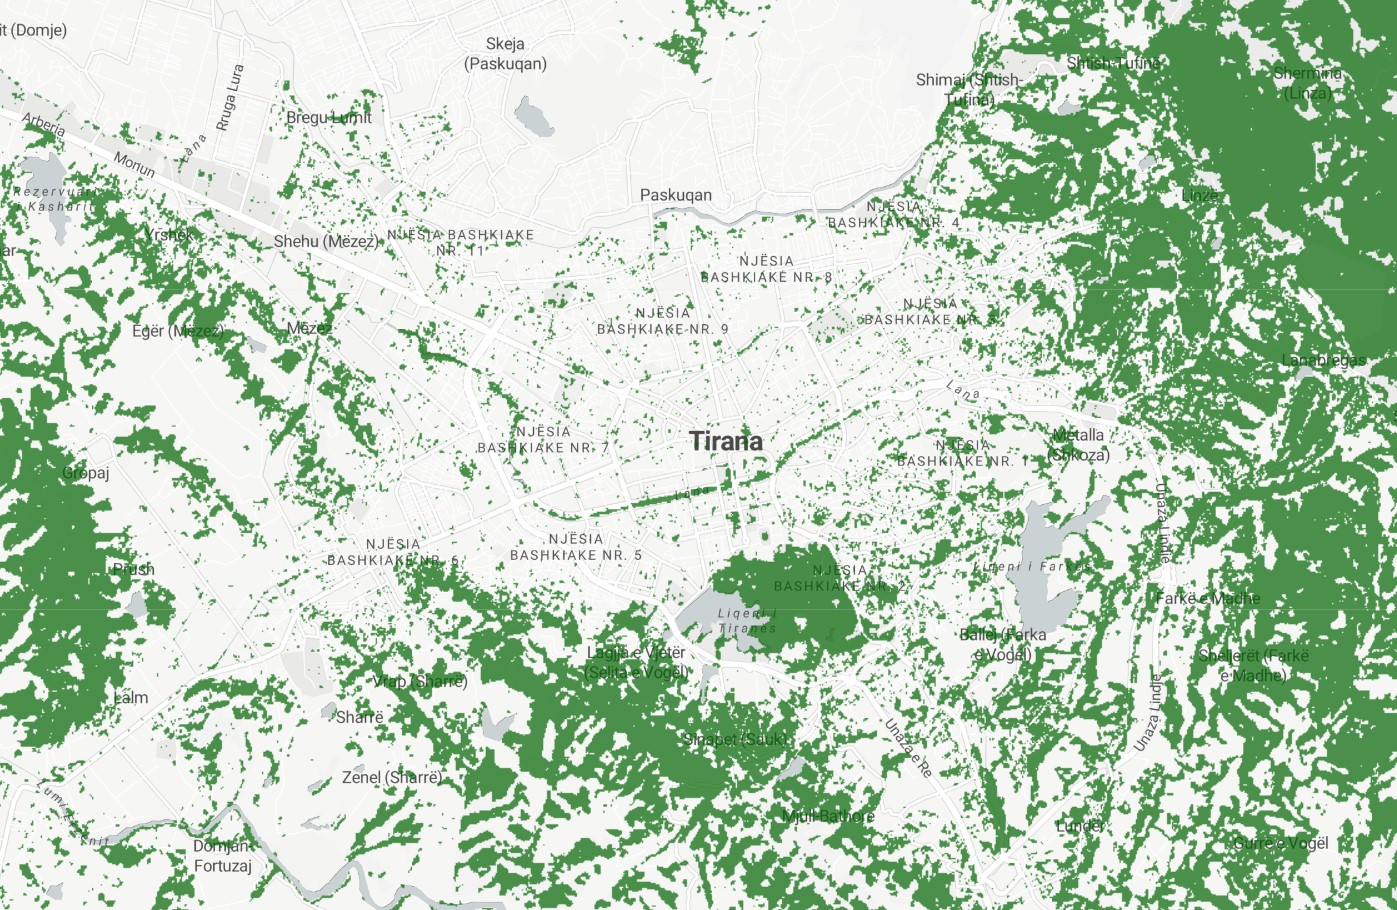
Available NowSatellite-derived Land Use / Land Cover computation of trees in 2020. Geospatially derived tree cover refers to information about areas of land that are covered by trees, such as forests, woodlands, and other areas with significant tree cover. This information is obtained using geographic information systems (GIS) technology, which allows for the creation of detailed maps and spatial datasets that can provide information about the location, extent, and characteristics of tree cover. These datasets are often used by researchers, governments, and organizations to monitor and manage forest resources, and to understand the impacts of changes in tree cover on the environment and local communities.
Resolution
10m
Cadence
Solo
Delivery
Hours
Price
€100
Coverage
Global
Data Range
1/1/2020 - 1/1/2021
EECU Seconds
16
GIZ
Trees
Herbaceous Wetlands
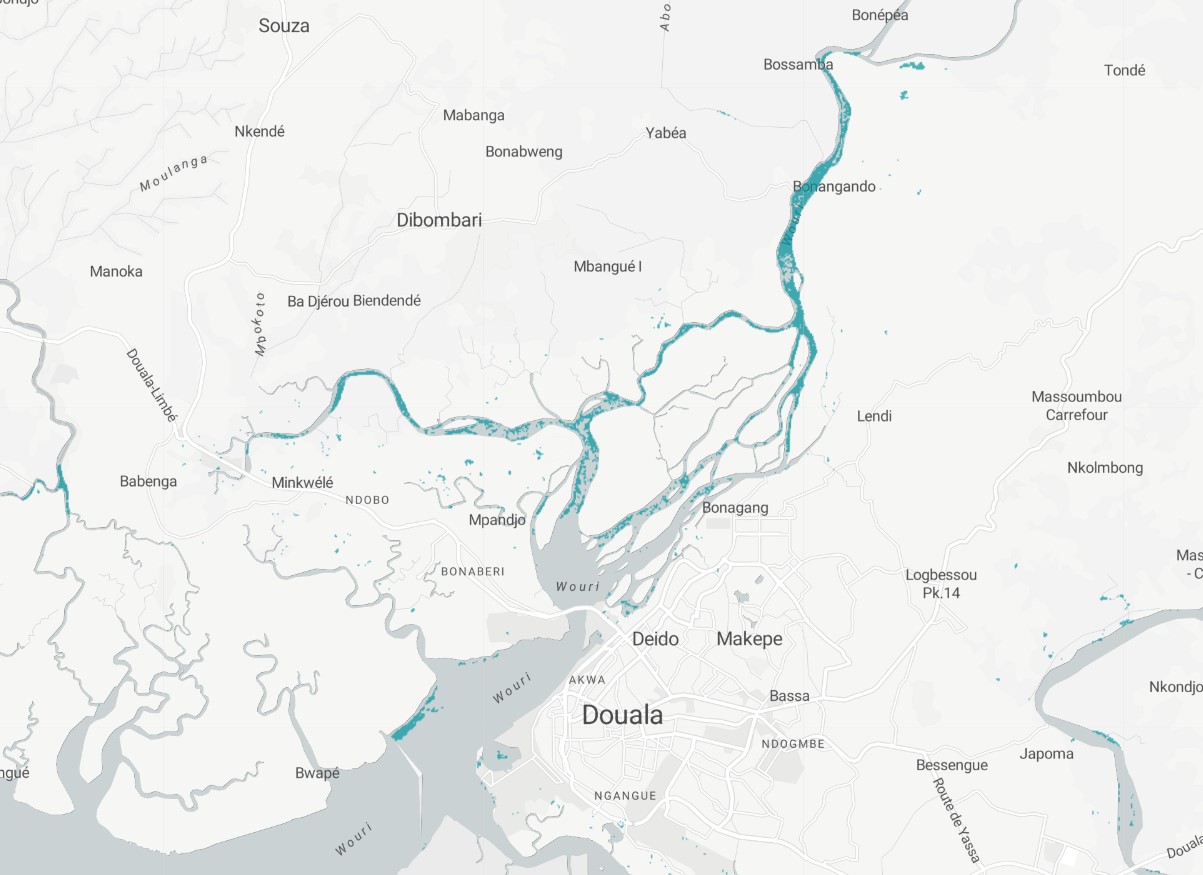
Available NowSatellite-derived Land Use / Land Cover computation of herbaceous wetlands in 2020. Geospatially derived herbaceous wetland refers to information about areas of land that are covered by herbaceous (non-woody) plants and are periodically inundated with water, such as marshes, swamps, and other wetland areas. This information is obtained using geographic information systems (GIS) technology, which allows for the creation of detailed maps and spatial datasets that can provide information about the location, extent, and characteristics of herbaceous wetlands. These datasets are often used by researchers, governments, and organizations to monitor and manage wetland resources, and to understand the impacts of changes in wetland cover on the environment and local communities.
Resolution
10m
Cadence
Solo
Delivery
Hours
Price
€100
Coverage
Global
Data Range
1/1/2020 - 1/1/2021
EECU Seconds
16
GIZ
Herbaceous Wetlands
Shrubland
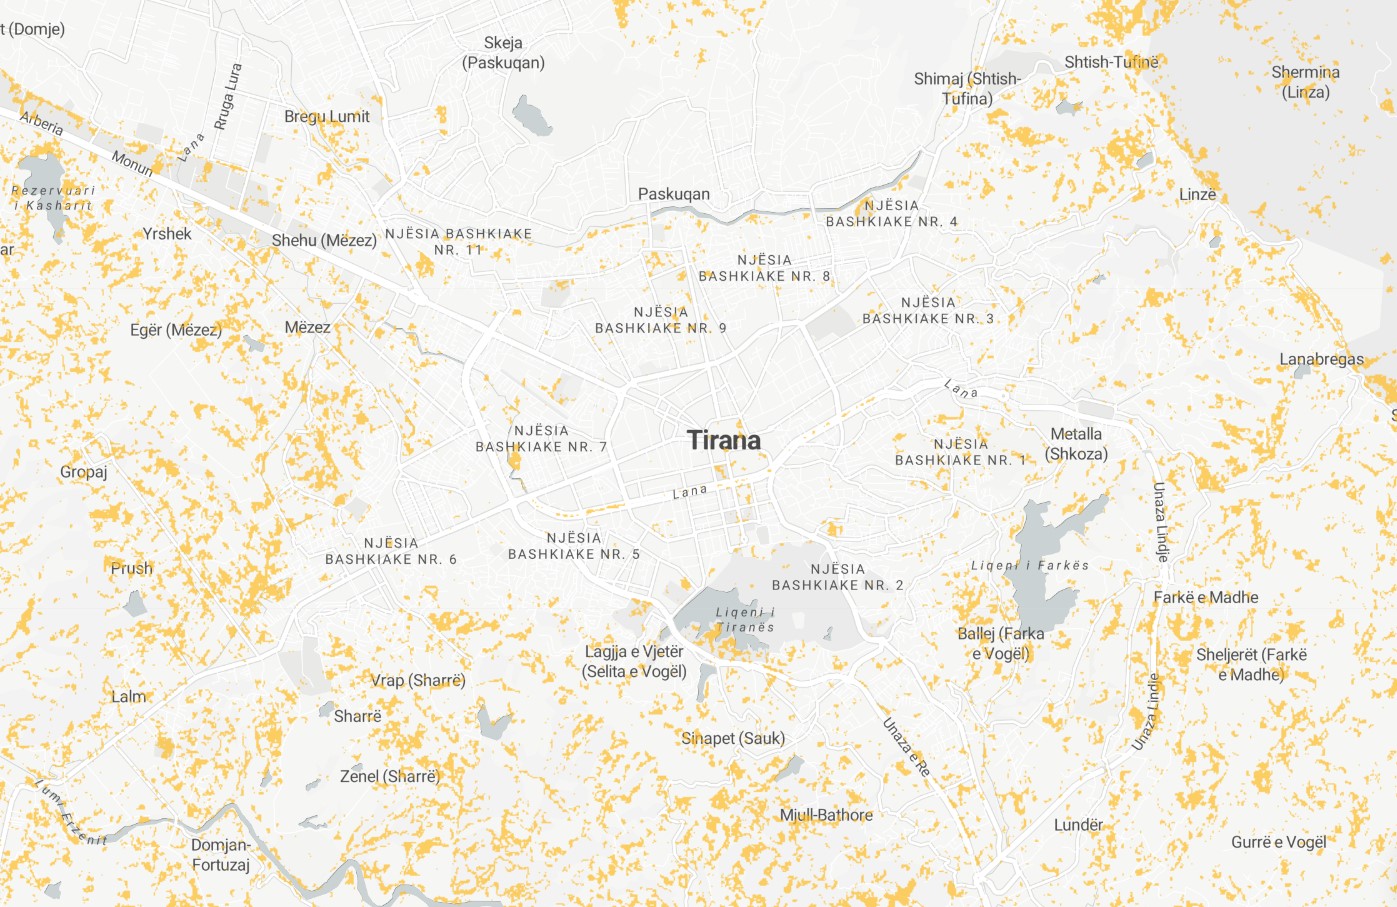
Available NowSatellite-derived Land Use / Land Cover computation of shrubland in 2020. Geospatially derived shrubland cover refers to information about areas of land that are covered by shrubs, such as scrublands, chaparral, and other areas with a dense growth of woody plants that are shorter than trees. This information is obtained using geographic information systems (GIS) technology, which allows for the creation of detailed maps and spatial datasets that can provide information about the location, extent, and characteristics of shrubland cover. These datasets are often used by researchers, governments, and organizations to monitor and manage land resources, and to understand the impacts of changes in shrubland cover on the environment and local communities.
Resolution
10m
Cadence
Solo
Delivery
Hours
Price
€100
Coverage
Global
Data Range
1/1/2020 - 1/1/2021
EECU Seconds
16
GIZ
Shrubland
Snow and Ice
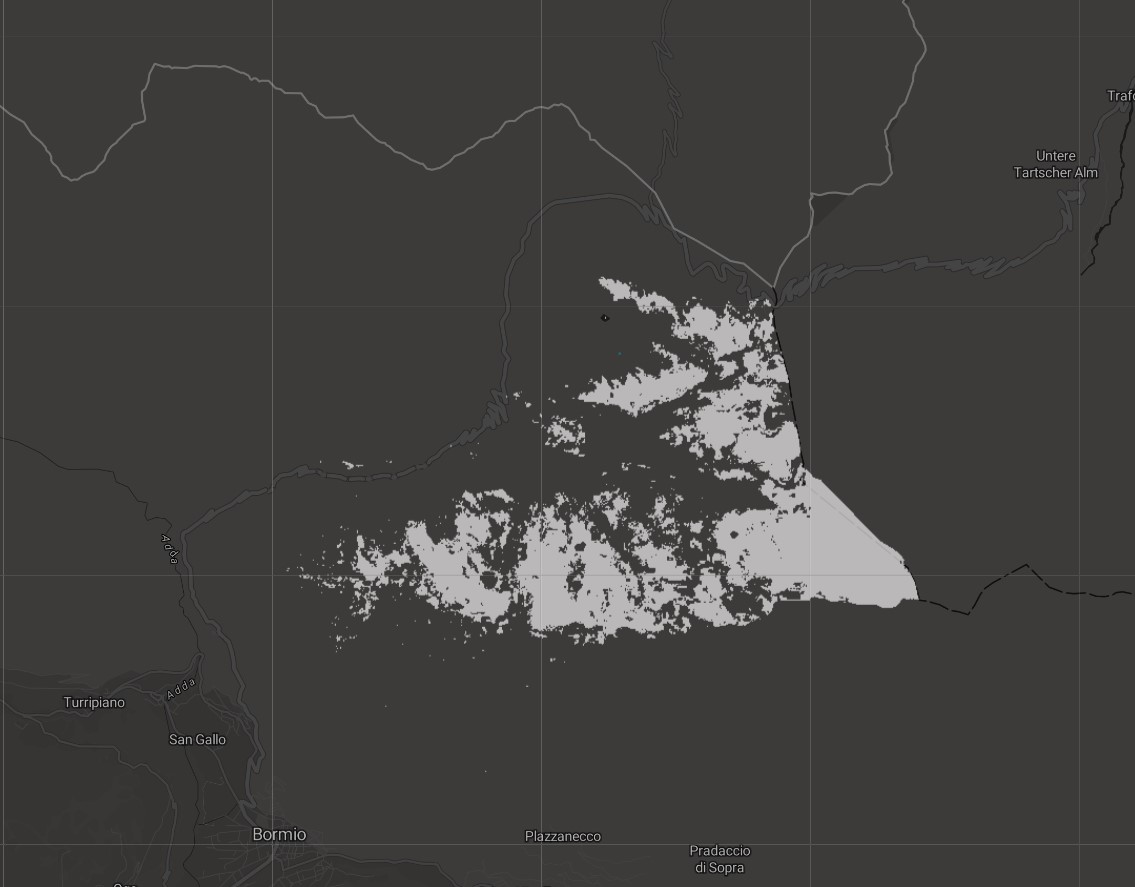
Available NowSatellite-derived Land Use / Land Cover computation of snow and ice in 2020. Geospatially derived snow and ice cover refers to information about areas of land that are covered by snow and ice, such as glaciers, snowfields, and other frozen landscapes. This information is obtained using geographic information systems (GIS) technology, which allows for the creation of detailed maps and spatial datasets that can provide information about the location, extent, and characteristics of snow and ice cover. These datasets are often used by researchers, governments, and organizations to monitor and manage water and land resources, and to understand the impacts of changes in snow and ice cover on the environment and local communities.
Resolution
10m
Cadence
Solo
Delivery
Hours
Price
€100
Coverage
Global
Data Range
1/1/2020 - 1/1/2021
EECU Seconds
8
GIZ
Snow and Ice
Grassland
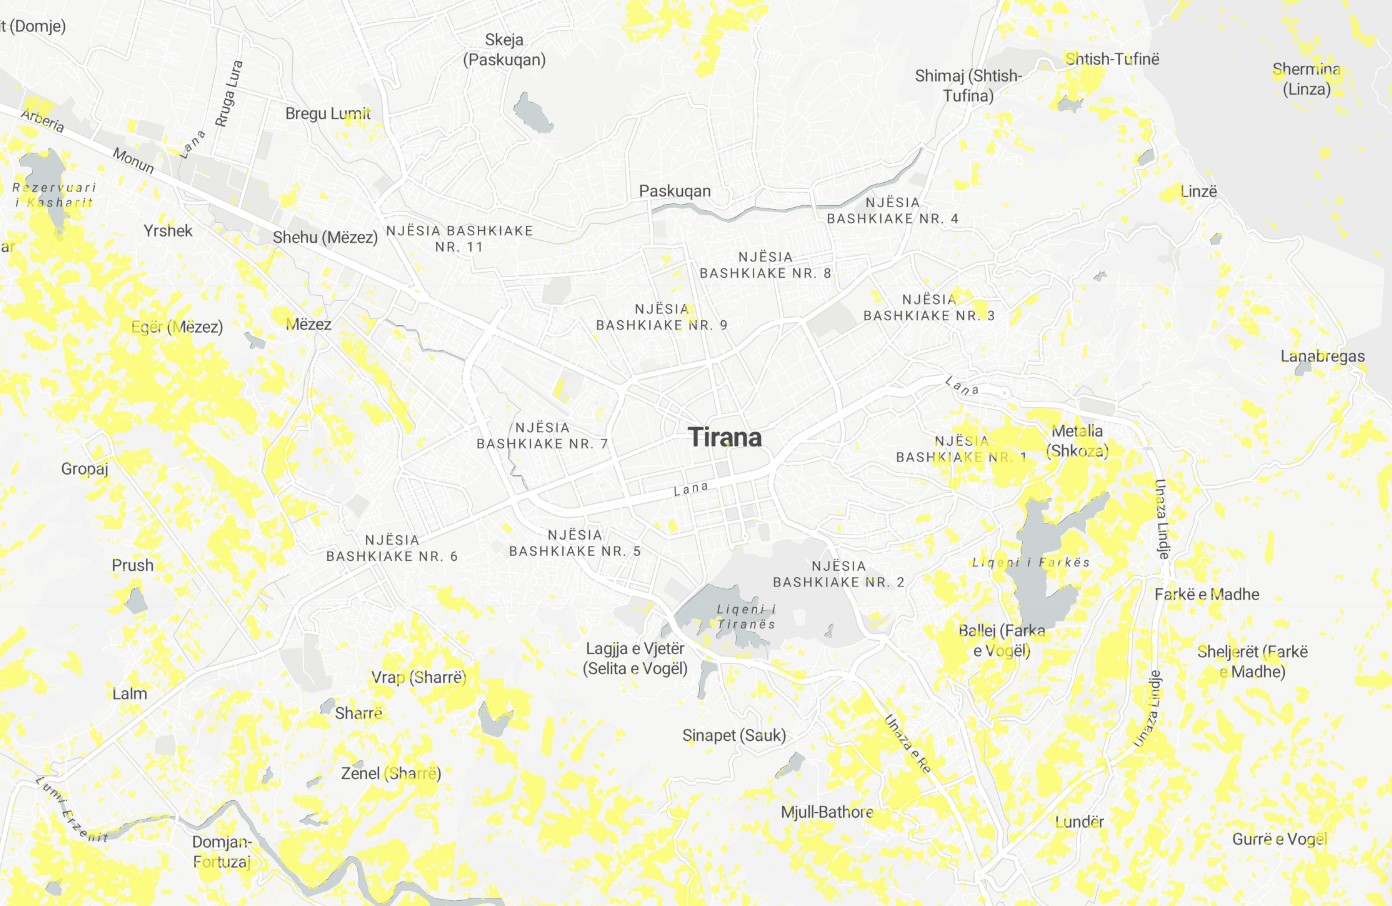
Available NowSatellite-derived Land Use / Land Cover computation of grassland in 2020. Geospatially derived grassland cover refers to information about areas of land that are covered by grasses and other herbaceous plants, such as meadows, pastures, and other grassland areas. This information is obtained using geographic information systems (GIS) technology, which allows for the creation of detailed maps and spatial datasets that can provide information about the location, extent, and characteristics of grassland cover. These datasets are often used by researchers, governments, and organizations to monitor and manage land resources, and to understand the impacts of changes in grassland cover on the environment and local communities.
Resolution
10m
Cadence
Solo
Delivery
Hours
Price
€100
Coverage
Global
Data Range
1/1/2020 - 1/1/2021
EECU Seconds
8
GIZ
Grassland
Mangroves
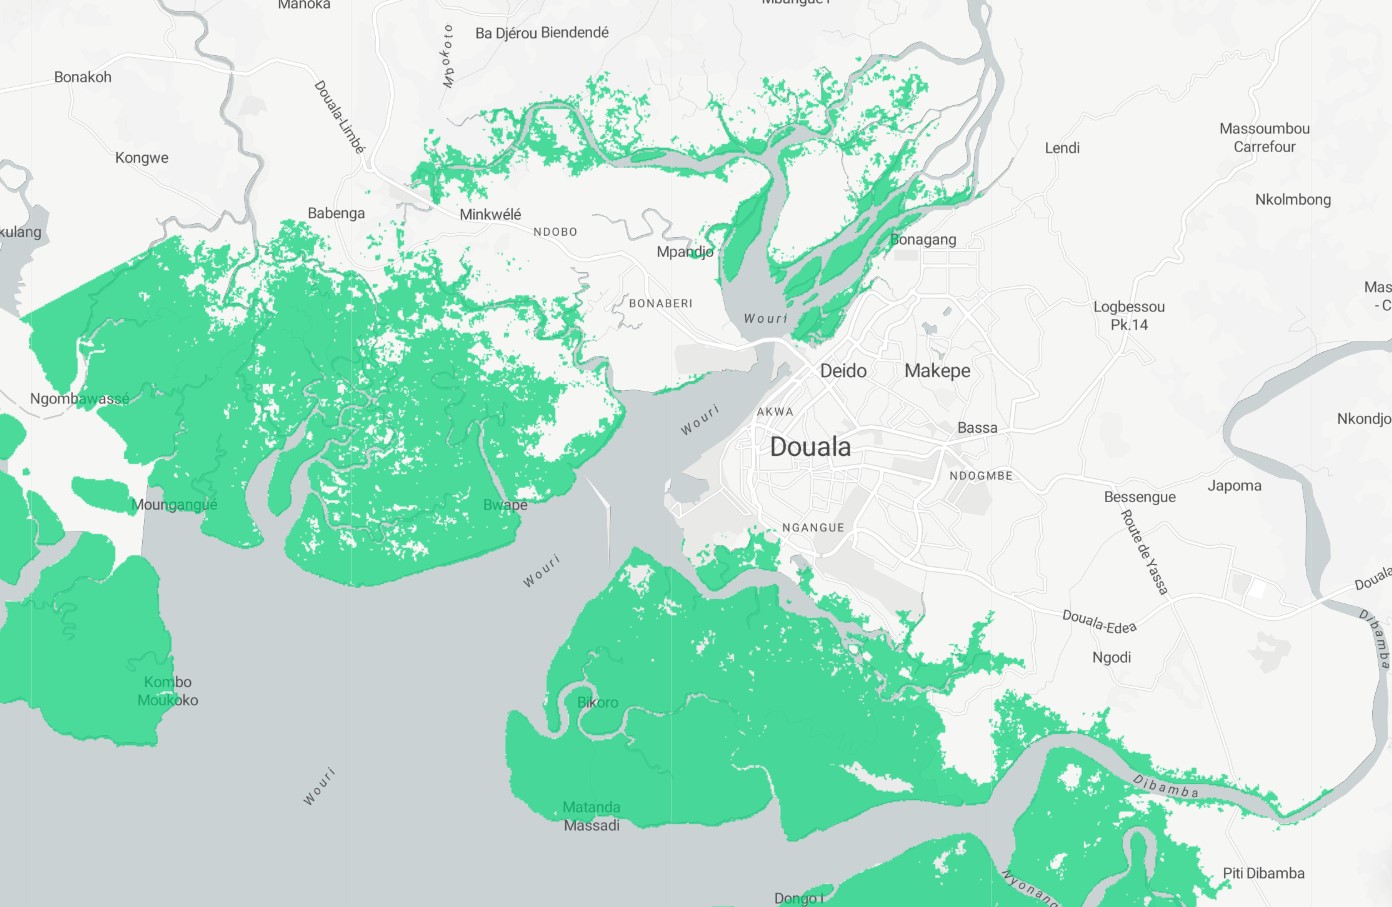
Available NowSatellite-derived Land Use / Land Cover computation of mangroves in 2020. Geospatially derived mangrove cover refers to information about areas of land that are covered by mangrove forests, which are a type of tropical coastal wetland that is characterized by its dense growth of salt-tolerant trees and shrubs. This information is obtained using geographic information systems (GIS) technology, which allows for the creation of detailed maps and spatial datasets that can provide information about the location, extent, and characteristics of mangrove cover. These datasets are often used by researchers, governments, and organizations to monitor and manage mangrove ecosystems, and to understand the impacts of changes in mangrove cover on the environment and local communities.
Resolution
10m
Cadence
Solo
Delivery
Hours
Price
€100
Coverage
Global
Data Range
1/1/2020 - 1/1/2021
EECU Seconds
8
GIZ
Mangroves
Moss and Lichens
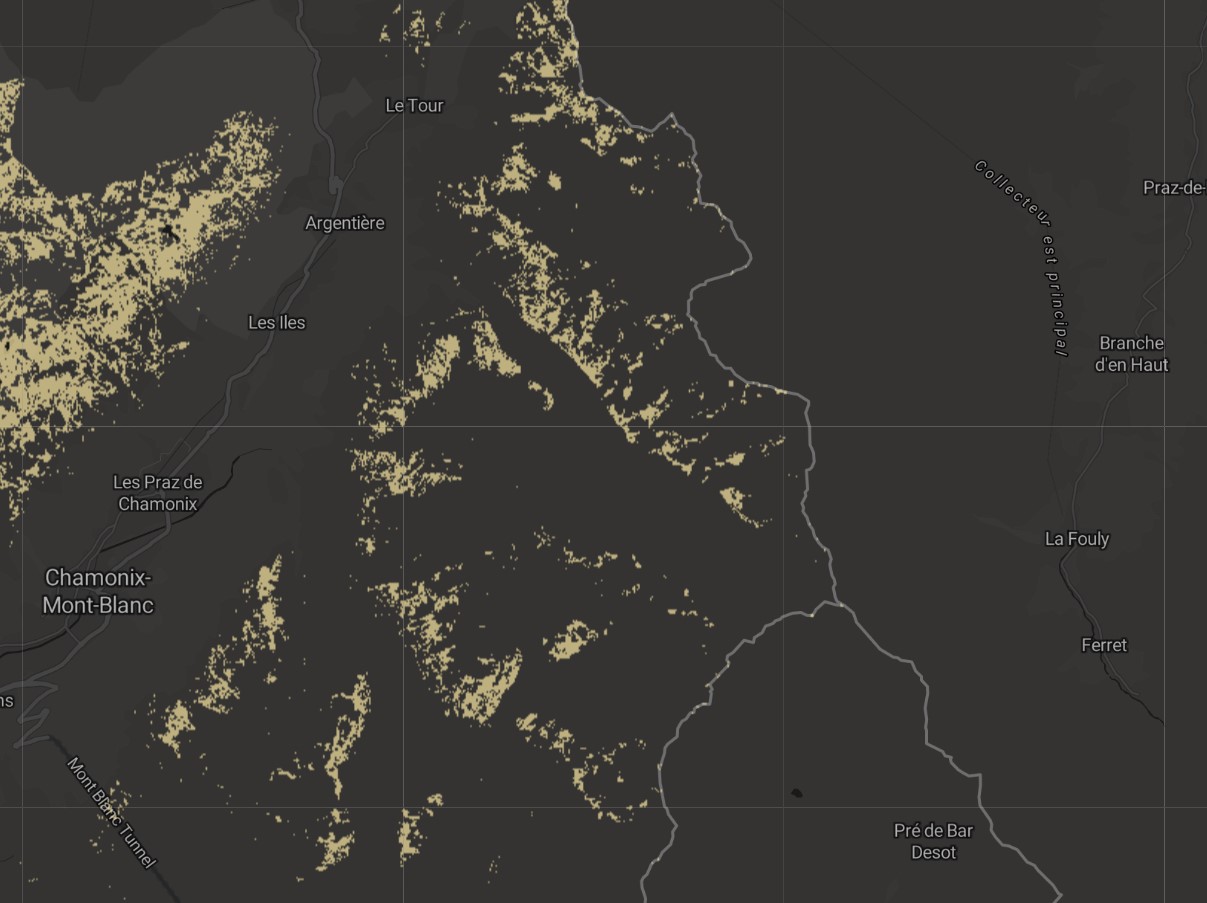
Available NowSatellite-derived Land Use / Land Cover computation of moss and lichens in 2020. Geospatially derived moss and lichen cover refers to information about areas of land that are covered by mosses and lichens, which are small, non-vascular plants that grow in damp, shady areas. This information is obtained using geographic information systems (GIS) technology, which allows for the creation of detailed maps and spatial datasets that can provide information about the location, extent, and characteristics of moss and lichen cover. These datasets are often used by researchers, governments, and organizations to monitor and manage land resources, and to understand the impacts of changes in moss and lichen cover on the environment and local communities.
Resolution
10m
Cadence
Solo
Delivery
Hours
Price
€100
Coverage
Global
Data Range
1/1/2020 - 1/1/2021
EECU Seconds
8
GIZ
Moss and Lichens
Aboveground Carbon Density
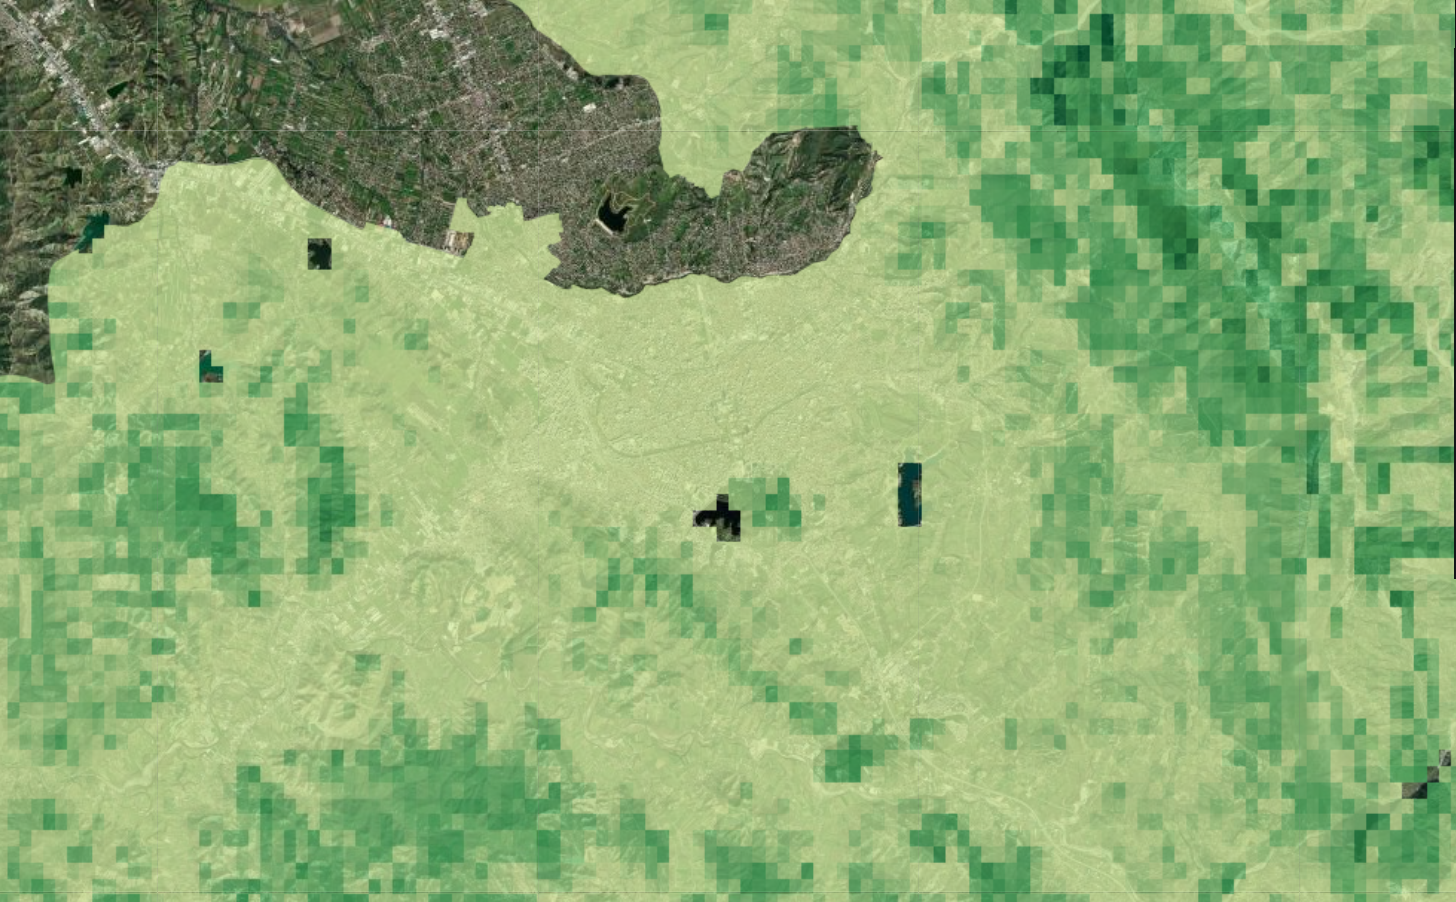
Available NowAboveground Biomass Carbon Density refers to the amount of carbon stored in the vegetation and woody components of forests or other terrestrial ecosystems. It is an important measure of carbon sequestration and plays a significant role in understanding the global carbon cycle and climate change. To estimate a combination of remote sensing data, field measurements, and modeling techniques are used. Field measurements are collected from various forest sites to validate and calibrate remote sensing data. These measurements include tree diameter, height, and biomass samples, which are then used to develop models that relate remote sensing data to aboveground biomass and carbon density. This data is valuable for a range of applications, including carbon accounting, forest management, and climate change research. It helps scientists and policymakers monitor changes in carbon stocks over time, assess the effectiveness of forest conservation efforts, and understand the role of forests in mitigating climate change.
Resolution
300m
Cadence
Solo
Delivery
Hours
Price
€100
Coverage
Global
Data Range
1/1/2010 - 1/1/2010
EECU Seconds
7
GIZ
Aboveground Carbon Density
Belowground Carbon Density
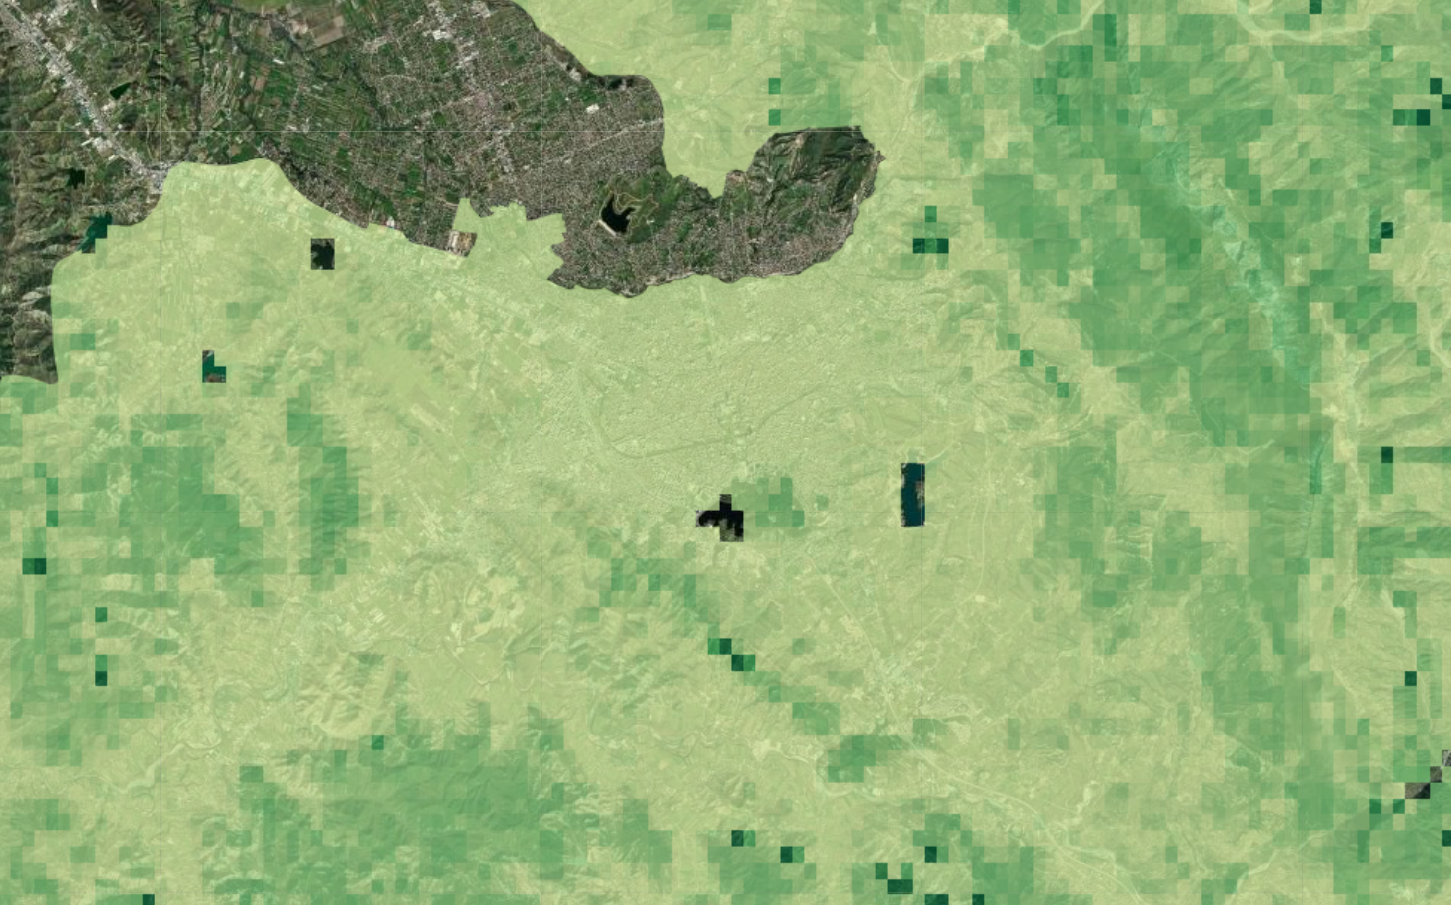
Available NowBelowground Biomass Carbon Density (BBCD) refers to the plant material found beneath the soil surface, including roots and rhizomes, which store a significant amount of carbon. The approach in estimating BBCD is through the integration of field-based measurements and modeling techniques. Field data from various sites is collected involving excavation and sampling of soil and root systems. These samples are then analyzed to determine the carbon content and other relevant properties. These ground-based measurements serve as a reference for developing models that can estimate BBCD based on remotely sensed data. Remote sensing data provides valuable contextual information related to soil properties, such as soil moisture and texture, which indirectly influence belowground biomass and carbon density. These data is incorporated into models that estimate BBCD, helping to refine the accuracy of predictions.
Resolution
300m
Cadence
Solo
Delivery
Hours
Price
€100
Coverage
Global
Data Range
1/1/2010 - 1/1/2010
EECU Seconds
17
GIZ
Belowground Carbon Density
Amenity Location
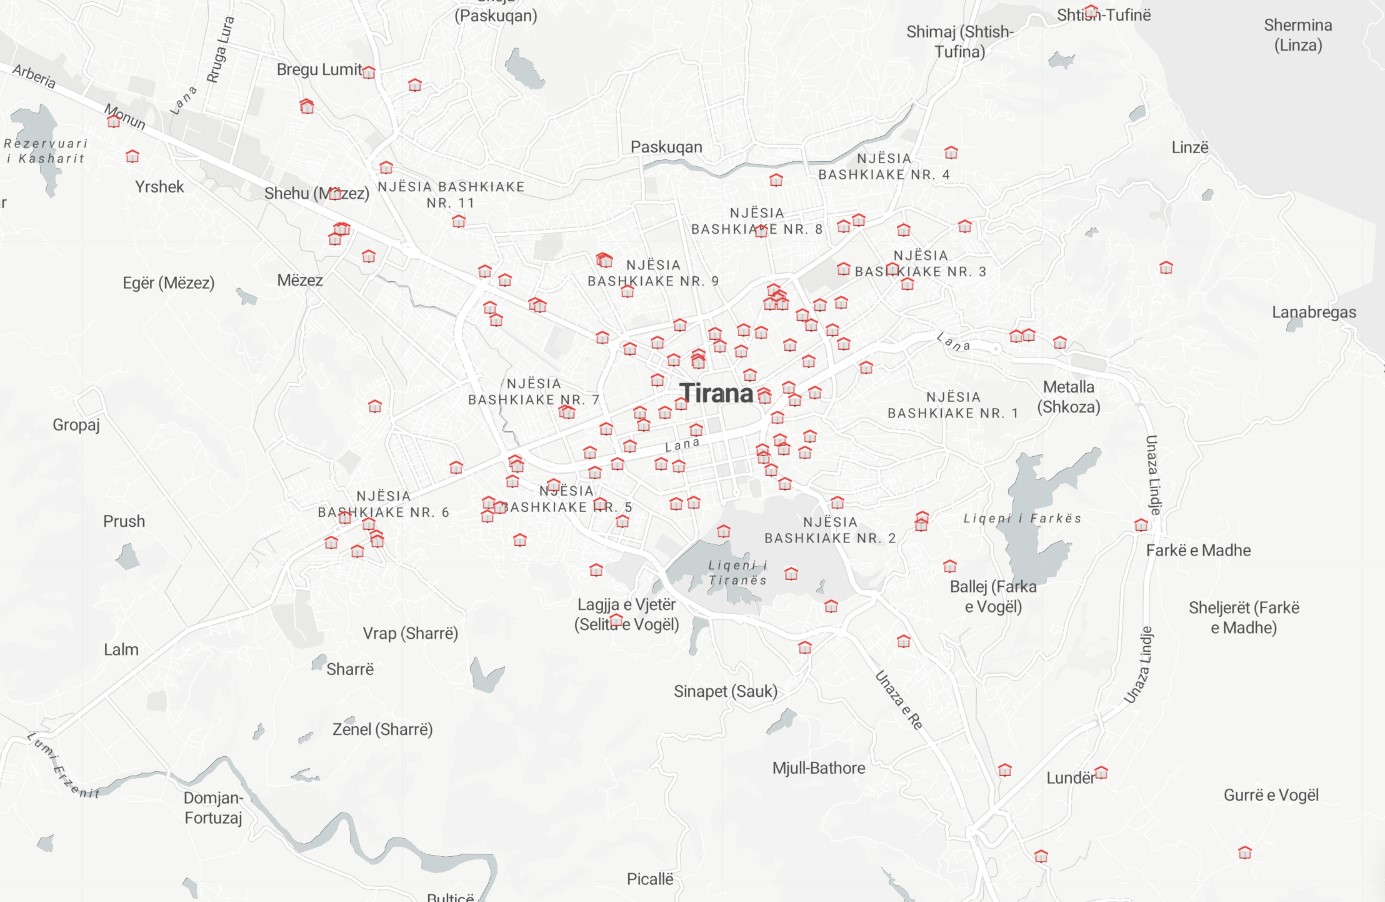
Available NowCrowdsourced amenity information and location. All amenities or a custom combination can be used to design a custom location index. A non-exhaustive list of possible amenities includes: parking, fuel stations, taxi stations, supermarkets, convenience stores, postal offices, ATMs, money transfer offices, waste disposal bins, recycling bins, urban trash bins, benches, fountains, schools, universities, kindergartens, drinking water stations, courthouses, police stations, places of worship, community centers, shelters, pharmacies, clinics, hospitals. Full list: https://wiki.openstreetmap.org/wiki/Key:amenity
Resolution
1m
Cadence
Live
Delivery
Hours
Price
€50
Coverage
Global
Data Range
n/a
EECU Seconds
-
GIZ
Amenity Location
Amenity Accessibility
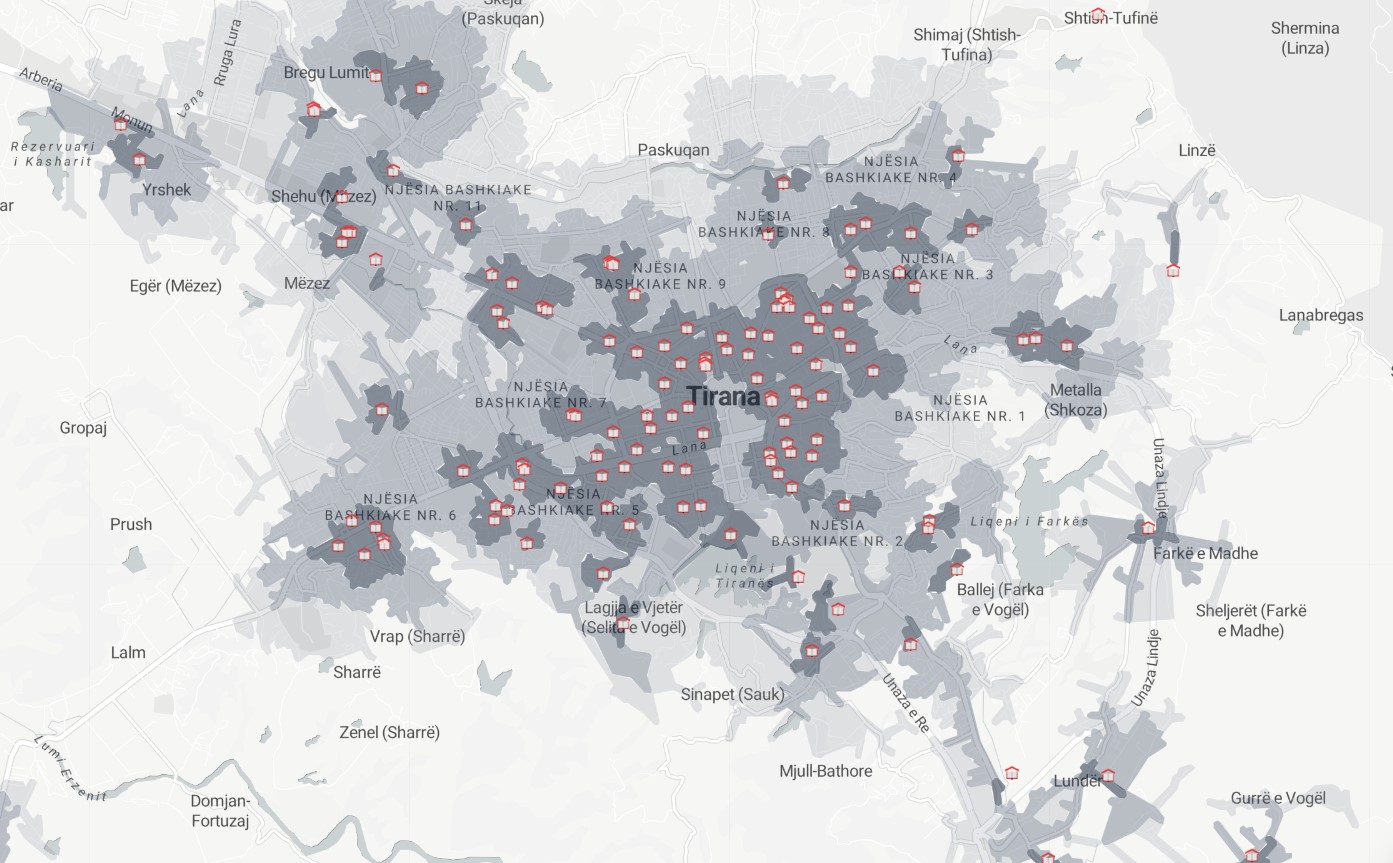
Available NowAn isochrone accessibility analysis is a type of spatial analysis that is used to evaluate the accessibility of different locations based on the amount of time it takes to travel between them by walking, biking or driving. In this analysis, isochrones are drawn on a map to represent lines of equal travel time, and these lines are used to identify areas that are within a certain travel time from a given location. This type of analysis is commonly used to assess the accessibility of services and amenities, such as schools, hospitals, and transportation hubs, and can help to identify areas that may be underserved or difficult to access. All amenities or a custom combination can be used to design a custom accessibility index. A non-exhaustive list of possible amenities includes: parking, fuel stations, taxi stations, supermarkets, convenience stores, postal offices, ATMs, money transfer offices, waste disposal bins, recycling bins, urban trash bins, benches, fountains, schools, universities, kindergartens, drinking water stations, courthouses, police stations, places of worship, community centers, shelters, pharmacies, clinics, hospitals. Full list: https://wiki.openstreetmap.org/wiki/Key:amenity
Resolution
1m
Cadence
Live
Delivery
Days
Price
€200
Coverage
Global
Data Range
n/a
EECU Seconds
-
GIZ
Amenity Accessibility
Amenity Deprivation
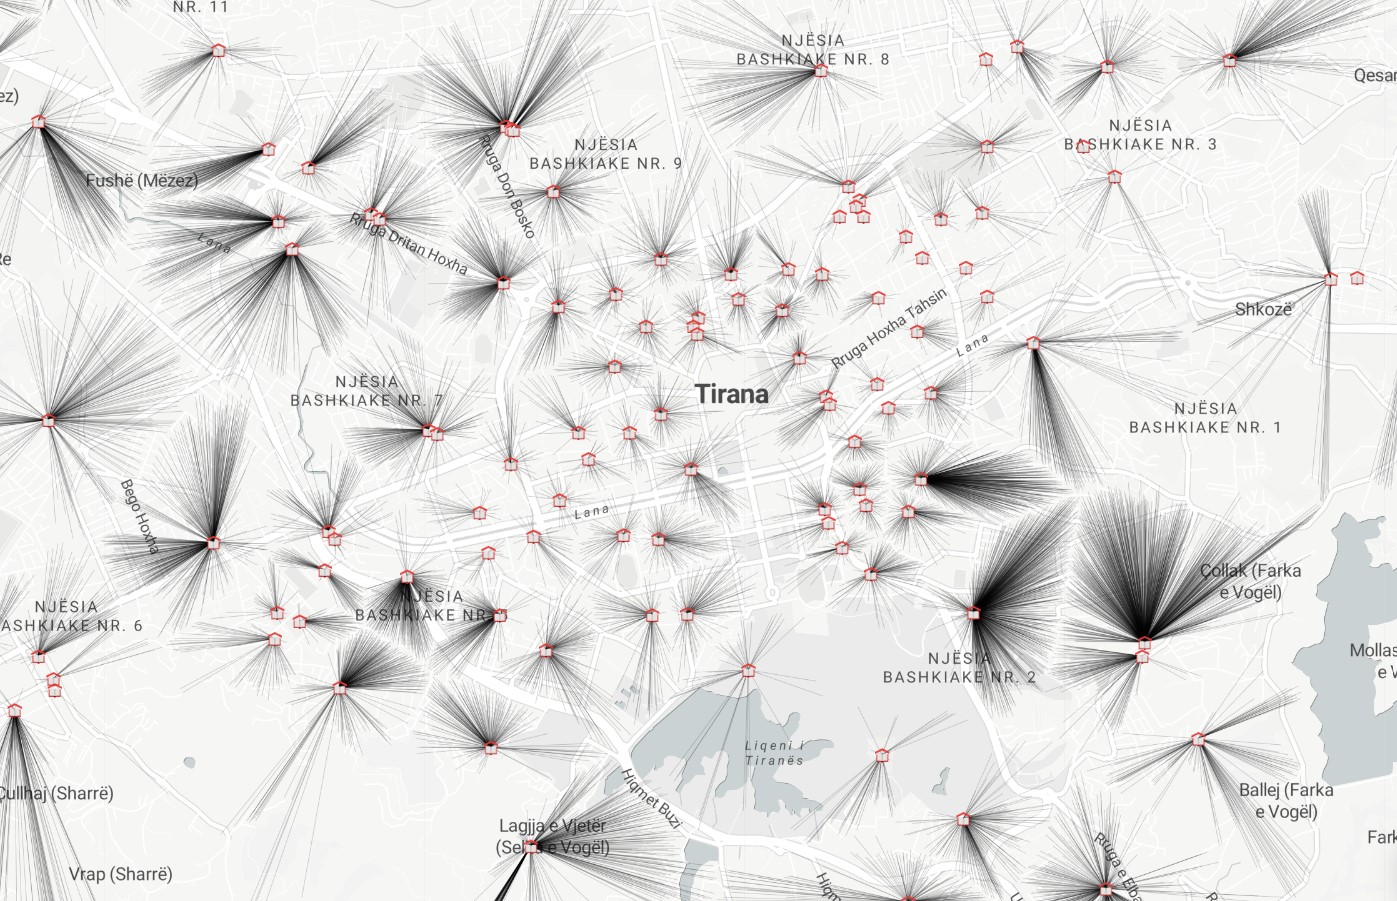
Available NowCustom beeline computation of all urban buildings connected with their closest school. Amenity deprivation analysis is a type of spatial analysis that is used to evaluate the availability of services and amenities in different areas, such as schools, hospitals, parks, and other public facilities. This analysis typically involves the use of geographic information systems (GIS) technology to create maps and spatial datasets that can be used to identify areas that may be deprived of certain amenities, and to understand the factors that contribute to amenity deprivation. This type of analysis can be used to support efforts to improve access to services and amenities, and to address inequalities in the distribution of resources and opportunities within a community. All amenities or a custom combination can be used to design a custom deprivation index. A non-exhaustive list of possible amenities includes: parking, fuel stations, taxi stations, supermarkets, convenience stores, postal offices, ATMs, money transfer offices, waste disposal bins, recycling bins, urban trash bins, benches, fountains, schools, universities, kindergartens, drinking water stations, courthouses, police stations, places of worship, community centers, shelters, pharmacies, clinics, hospitals. Full list: https://wiki.openstreetmap.org/wiki/Key:amenity
Resolution
1m
Cadence
Live
Delivery
Days
Price
€200
Coverage
Global
Data Range
n/a
EECU Seconds
-
GIZ
Amenity Deprivation
Multiple Accessibility Index
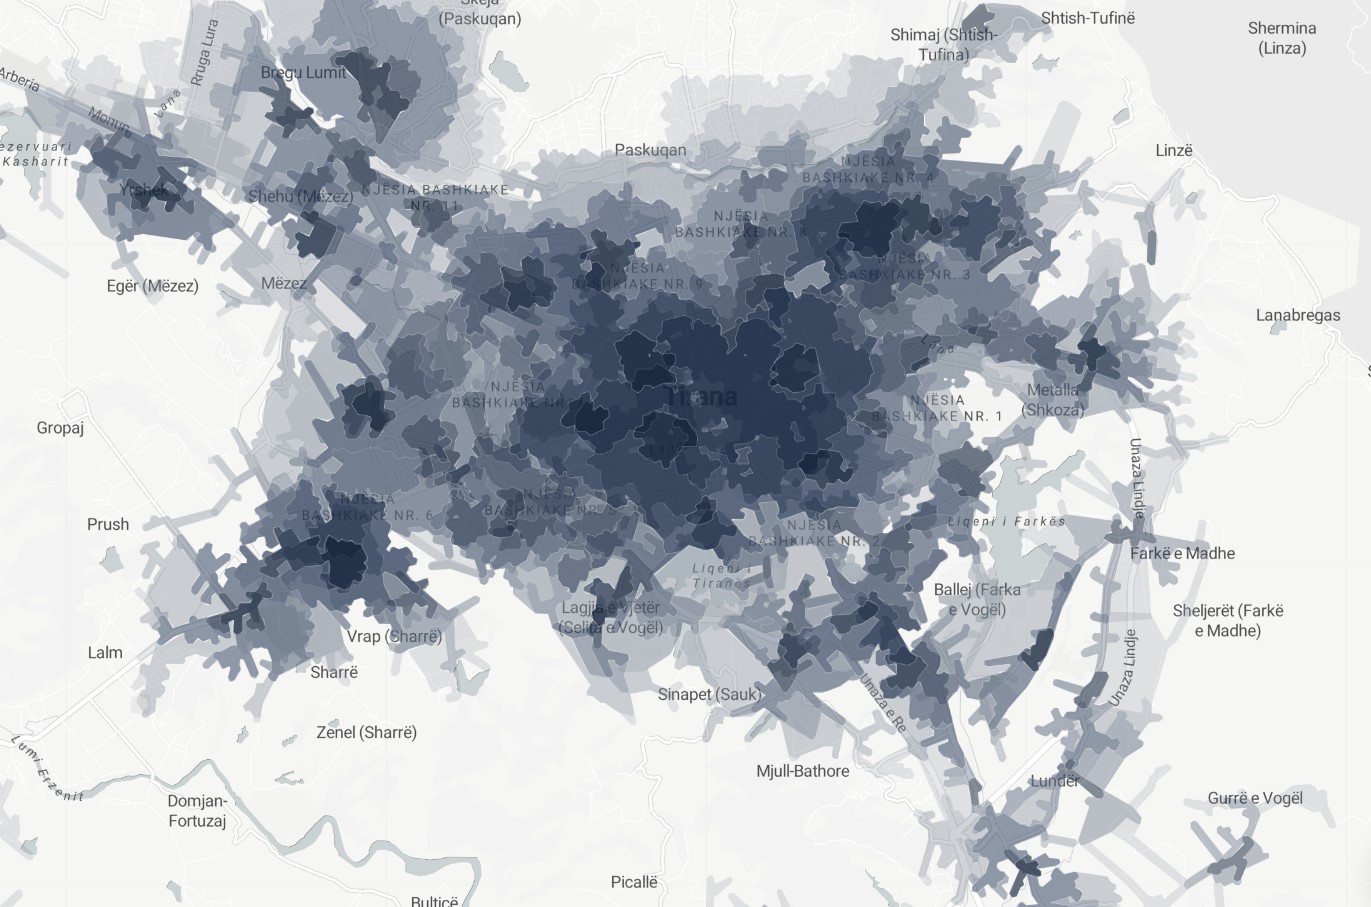
Available NowLayer's Multiple Accessibility Index™ (MAI) - Our index overlays 19 indicators in providing a comprehensive view of service accessibility coverage at 10min/15min and 30min walking distance intervals. A multiple accessibility index spatial analysis is a type of spatial analysis that is used to evaluate the accessibility of different locations based on the distance or time it takes to travel between them, using multiple accessibility indices. In this analysis, multiple accessibility indices are calculated for each location, each of which represents a different aspect of accessibility, such as the availability of public transportation or the proximity to services and amenities. This type of analysis is commonly used to assess the overall accessibility of an area, and can help to identify areas that may be underserved or difficult to access in multiple ways. The results of a multiple accessibility index spatial analysis can be used to support efforts to improve access to services and amenities, and to address inequalities in the distribution of resources and opportunities within a community.
Resolution
1m
Cadence
Live
Delivery
Days
Price
€500
Coverage
Global
Data Range
n/a
EECU Seconds
-
GIZ
Multiple Accessibility Index
Amenity Hexessibility
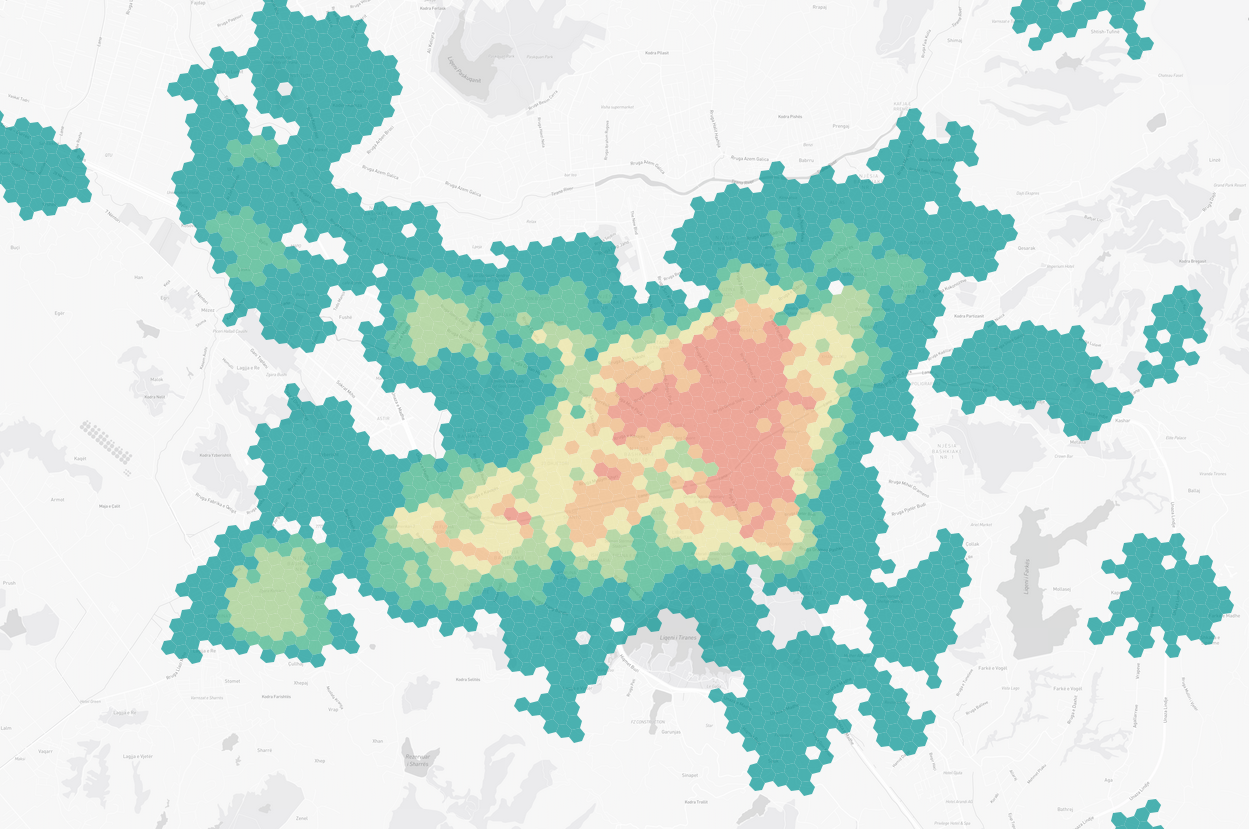
Available NowAn isochrone accessibility analysis is a type of spatial analysis that is used to evaluate the accessibility of different locations based on the amount of time it takes to travel between them by walking, biking or driving. In this analysis, isochrones are drawn on a map to represent lines of equal travel time, and these lines are used to identify areas that are within a certain travel time from a given location. In our amenity hexessiblity we turn the tables indicating the number of amenities available at any location in a city - therefore not only illustrating coverage, but also the quantity of coverage for a specific amenity around a city. This type of analysis is commonly used to assess the accessibility of services and amenities, such as schools, hospitals, and transportation hubs, and can help to identify areas that may be underserved or difficult to access. All amenities or a custom combination can be used to design a custom accessibility index. A non-exhaustive list of possible amenities includes: parking, fuel stations, taxi stations, supermarkets, convenience stores, postal offices, ATMs, money transfer offices, waste disposal bins, recycling bins, urban trash bins, benches, fountains, schools, universities, kindergartens, drinking water stations, courthouses, police stations, places of worship, community centers, shelters, pharmacies, clinics, hospitals. Full list: https://wiki.openstreetmap.org/wiki/Key:amenity
Resolution
1m
Cadence
Live
Delivery
Hours
Price
€200
Coverage
Global
Data Range
n/a
EECU Seconds
-
GIZ
Amenity Hexessibility
Network Analysis
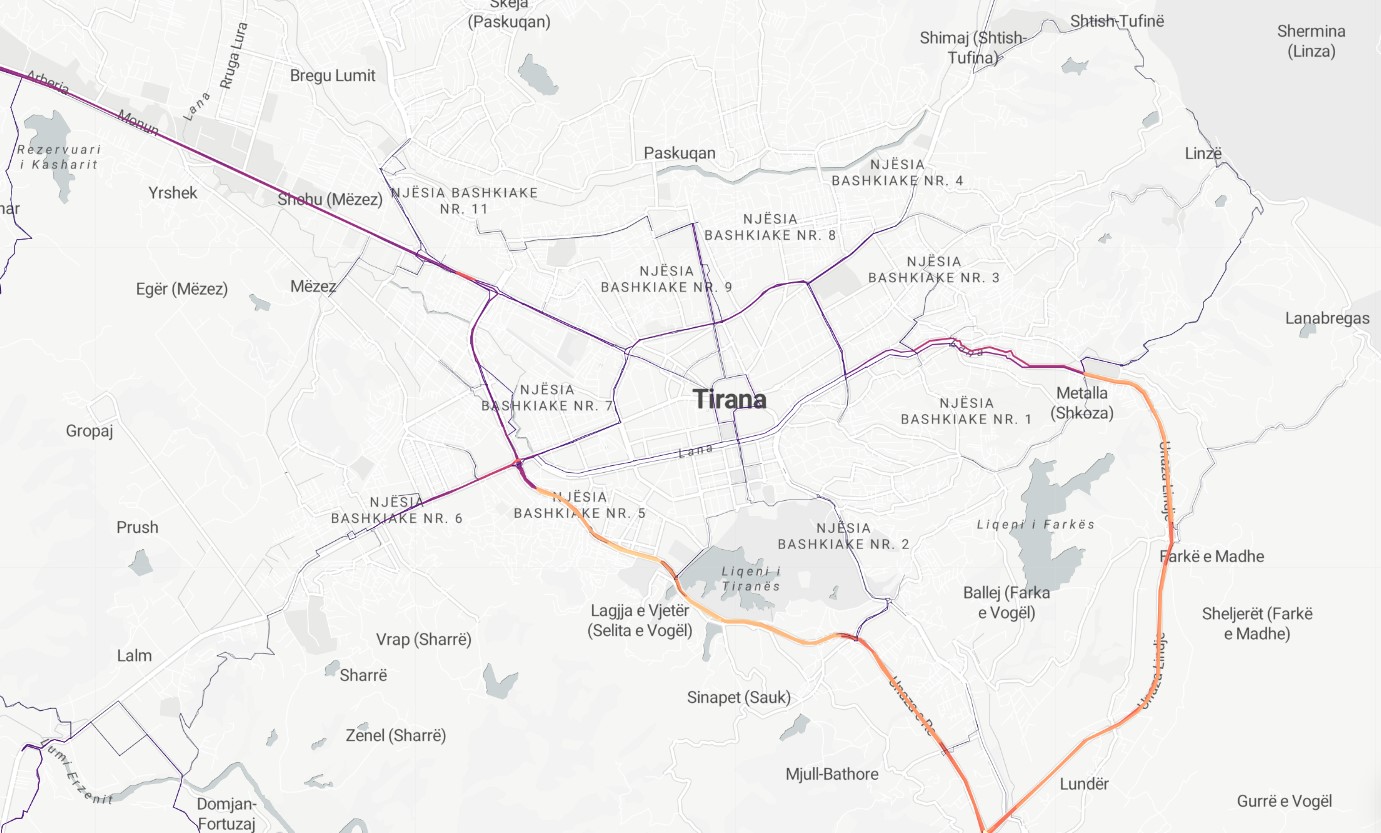
Available NowBetweenness network analysis is a type of spatial analysis that is used to evaluate the connectivity of a street network by measuring the extent to which different streets serve as "bridges" between other streets in the network. In this analysis, the betweenness centrality of each street is calculated, which is a measure of the number of shortest paths between other streets that pass through that street. Streets with high betweenness centrality are considered to be more important in terms of connectivity, as they are likely to be used by many people as they travel through the network. This type of analysis can be used to understand the efficiency and effectiveness of a street network, and to identify potential bottlenecks or other problems that may impact the flow of traffic.
Resolution
1m
Cadence
Live
Delivery
Days
Price
€200
Coverage
Global
Data Range
n/a
EECU Seconds
-
GIZ
Network Analysis
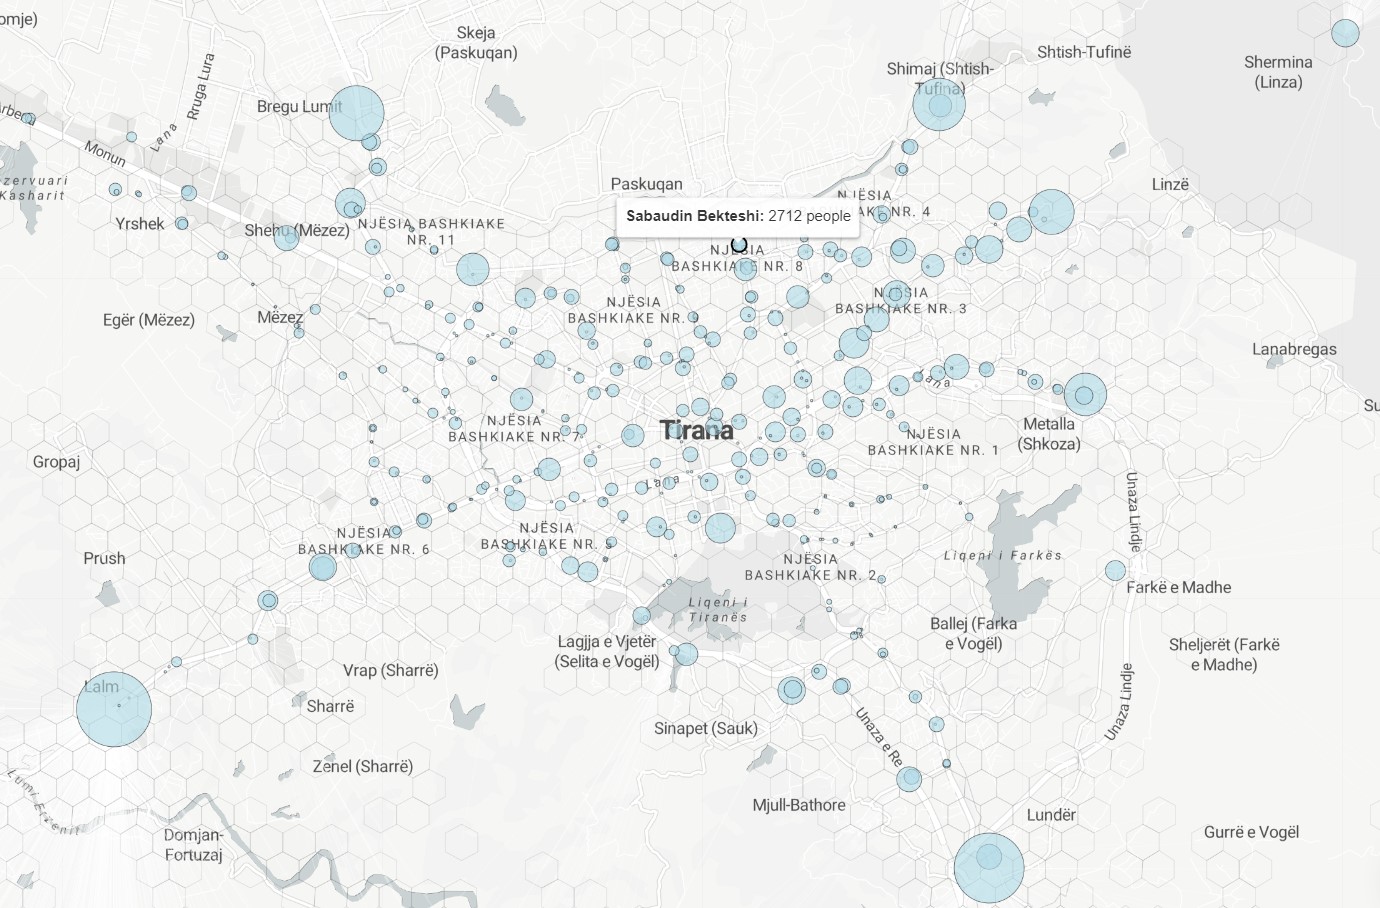
Public Transport Density Map
Available NowCrowdsourced public transportation and population density analysis. Sample provided is a combination of Worldpop population counts and crowdsourced data. A non-exhaustive list of possible amenities includes: parking, fuel stations, taxi stations, supermarkets, convenience stores, postal offices, ATMs, money transfer offices, waste disposal bins, recycling bins, urban trash bins, benches, fountains, schools, universities, kindergartens, drinking water stations, courthouses, police stations, places of worship, community centers, shelters, pharmacies, clinics, hospitals. Full list: https://wiki.openstreetmap.org/wiki/Key:amenity
Resolution
1m
Cadence
Live
Delivery
Days
Price
€200
Coverage
Global
Data Range
n/a
EECU Seconds
-
GIZ
Public Transport Density Map
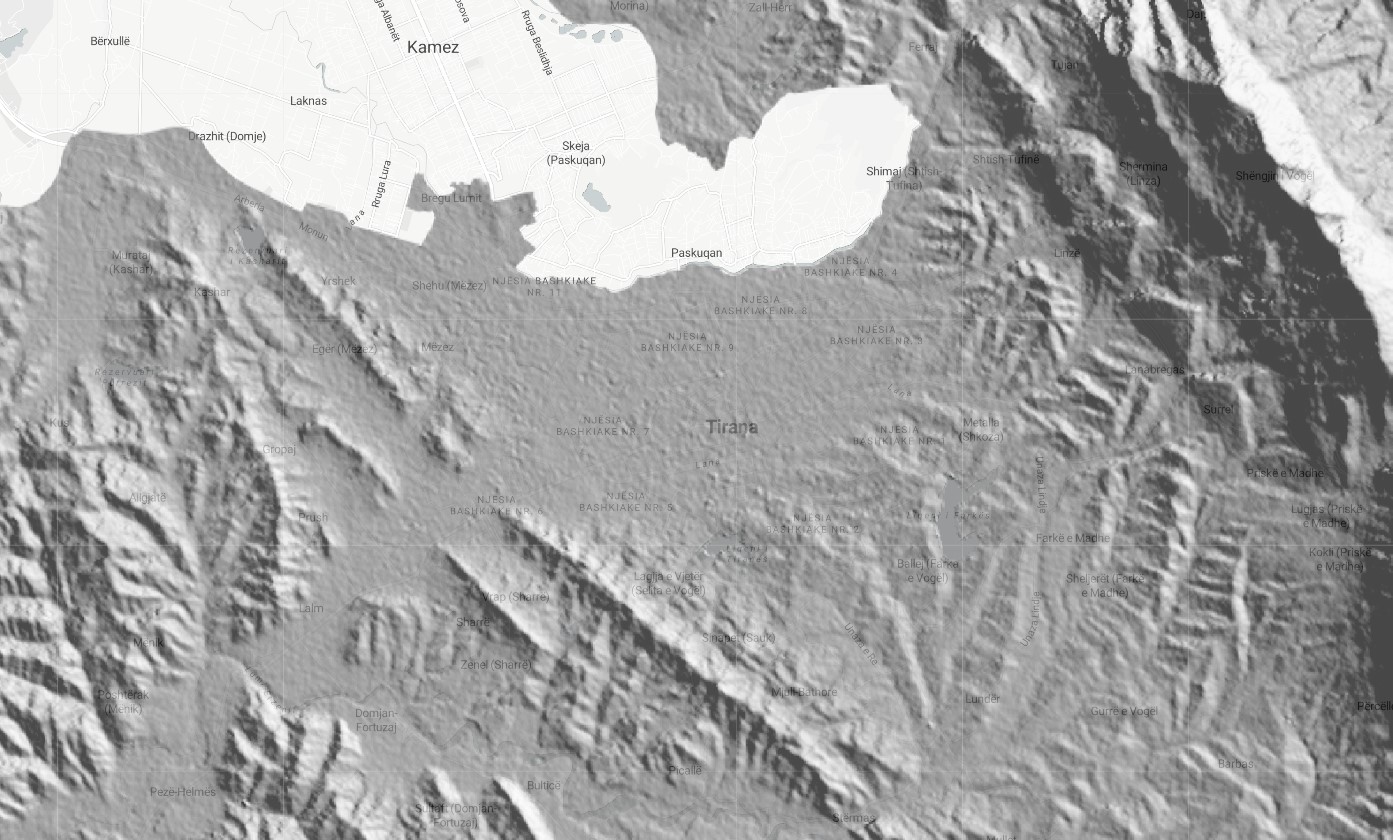
Hillshade Topography
Available NowSatellite-derived hillshade visualization of geographical features. Geospatially derived hillshade is a type of map or spatial dataset that is created using geographic information systems (GIS) technology to represent the three-dimensional relief of a terrain. Hillshades are typically generated by applying shading algorithms to a digital elevation model (DEM) of the terrain, which allows for the creation of realistic, three-dimensional visualizations of the land surface. These visualizations can be useful for a variety of purposes, such as for analyzing the topography of an area, for visualizing the distribution of natural or man-made features on the landscape, or for creating attractive maps for publication or presentation.
Resolution
30m
Cadence
Solo
Delivery
Hours
Price
€100
Coverage
Global
Data Range
2/11/2000 - 2/22/2000
EECU Seconds
28
GIZ
Hillshade Topography
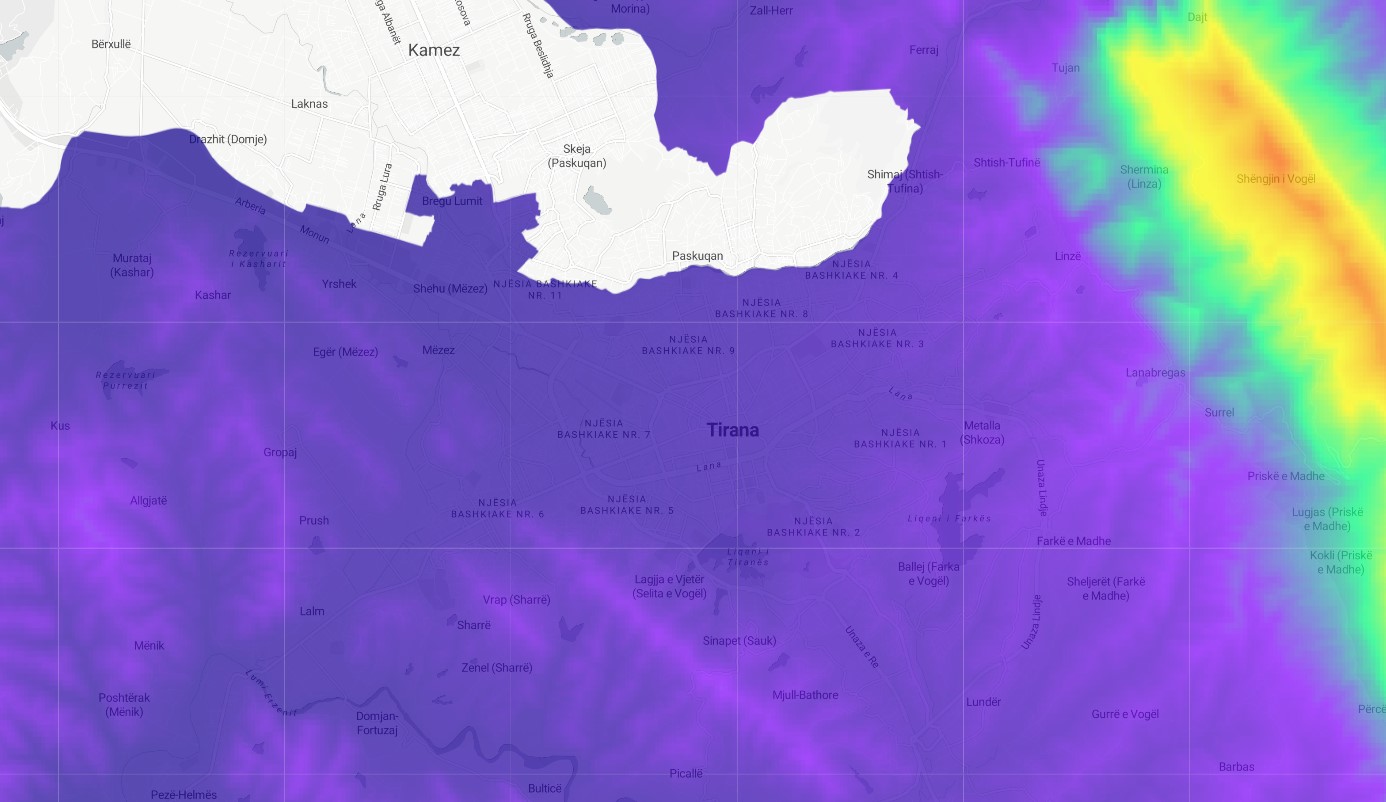
Digital Elevation Model
Available NowSatellite-derived Digital Elevation Model. A geospatially derived digital elevation model (DEM) is a type of spatial dataset that represents the three-dimensional relief of a terrain. DEMs are typically created using geographic information systems (GIS) technology, and are based on elevation data obtained from various sources, such as satellite imagery. These datasets can be used to create detailed maps and visualizations of the land surface, and can provide valuable information for a wide range of purposes, such as for analyzing the topography of an area, for understanding the distribution of natural or man-made features on the landscape, or for supporting the planning and management of land resources.
Resolution
90m
Cadence
Solo
Delivery
Hours
Price
€100
Coverage
Global
Data Range
2/11/2000 - 2/22/2000
EECU Seconds
26
GIZ
Digital Elevation Model
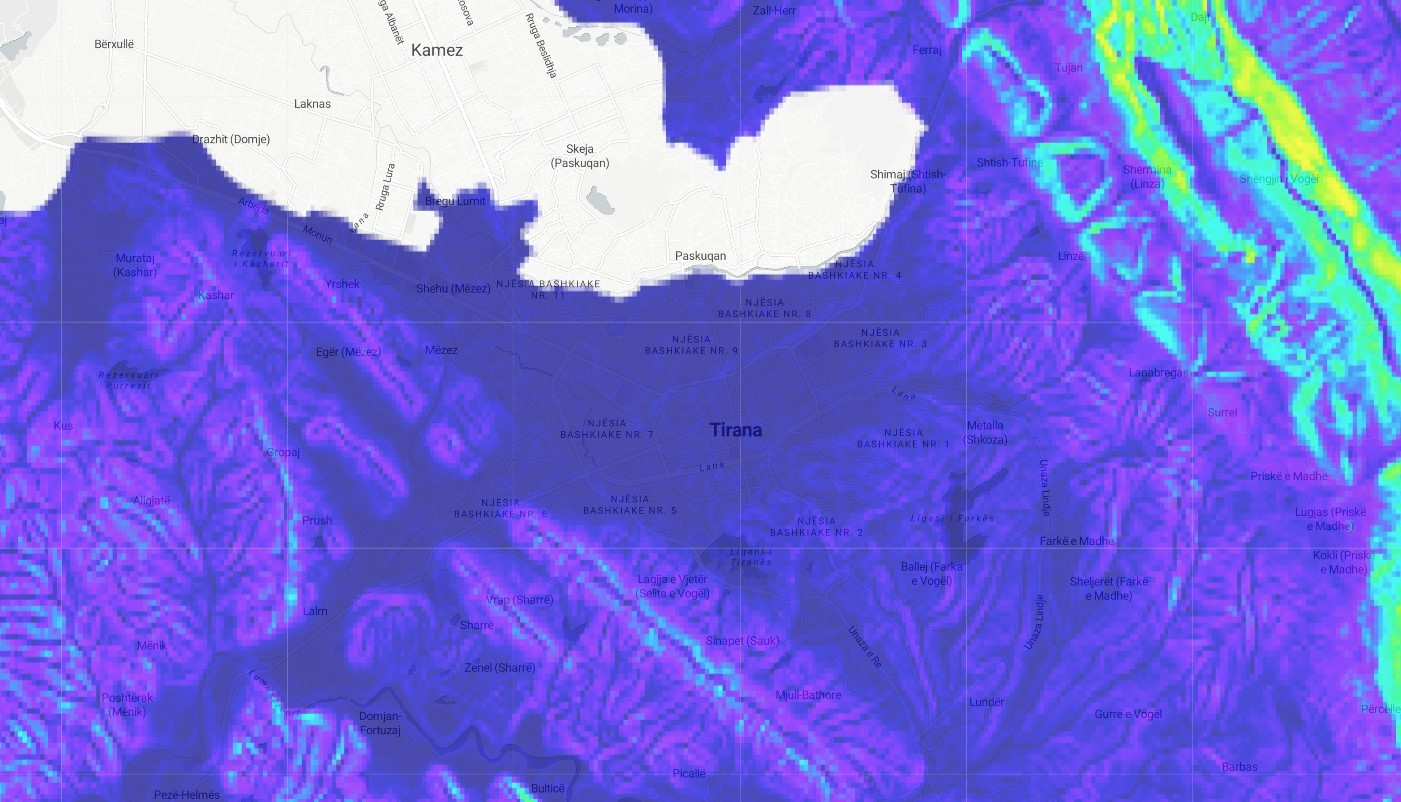
Digital Slope Model
Available NowSatellite-derived Digital Slope Model. Geospatially derived slope modelling is a type of spatial analysis that is used to evaluate the slope of a terrain, typically for the purpose of understanding the potential for erosion, landslides, or other hazards. In this analysis, a digital elevation model (DEM) of the terrain is used to calculate the slope of the land surface at each location, and this information is then mapped to show the distribution of slope across the area. This type of analysis can be useful for a variety of purposes, such as for identifying areas that may be at risk of erosion or landslides, for determining the suitability of an area for development, or for supporting the planning and management of land resources.
Resolution
30m
Cadence
Solo
Delivery
Hours
Price
€100
Coverage
Global
Data Range
2/11/2000 - 2/22/2000
EECU Seconds
13
GIZ
Digital Slope Model
Terrain Ruggedness
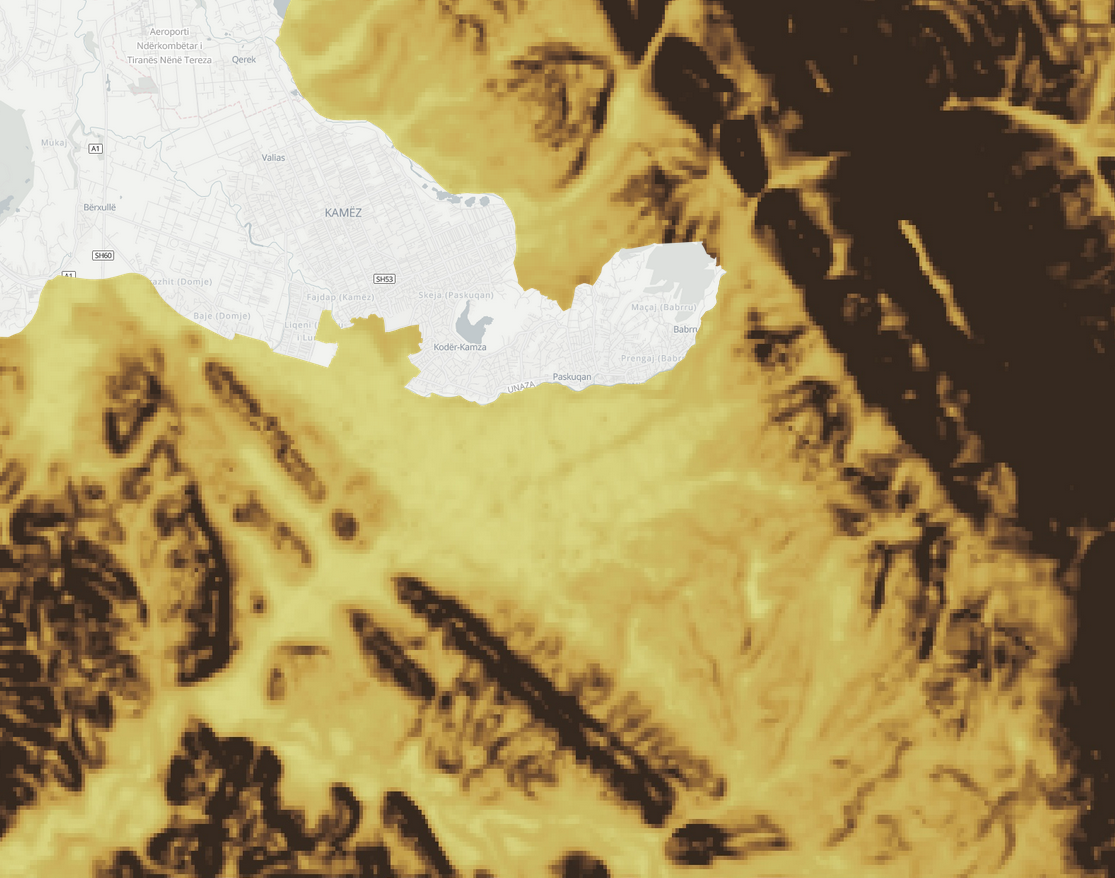
Available NowGeospatially derived terrain ruggedness is a measure of the roughness or ruggedness of a terrain, calculated from digital elevation data. It is commonly used in environmental and ecological studies to characterize the physical characteristics of a landscape and to understand the effects of terrain on the distribution and movement of animals, plants, and other organisms. It is calculated by first dividing the terrain into a grid of cells, and then using algorithms to calculate the slope and roughness of each cell. The slope is calculated as the difference in elevation between the cell and its neighbors, and the roughness is calculated as the standard deviation of the elevations within the cell. The Index is then calculated as the average slope and roughness of all the cells in the grid. In general, however, the index is a useful tool for quantifying and comparing the ruggedness of different landscapes and for understanding the ecological and environmental impacts of terrain on the distribution and behavior of organisms.
Resolution
90m
Cadence
Solo
Delivery
Hours
Price
€100
Coverage
Global
Data Range
2/11/2000 - 2/22/2000
EECU Seconds
11
GIZ
Terrain Ruggedness
Compound Topography
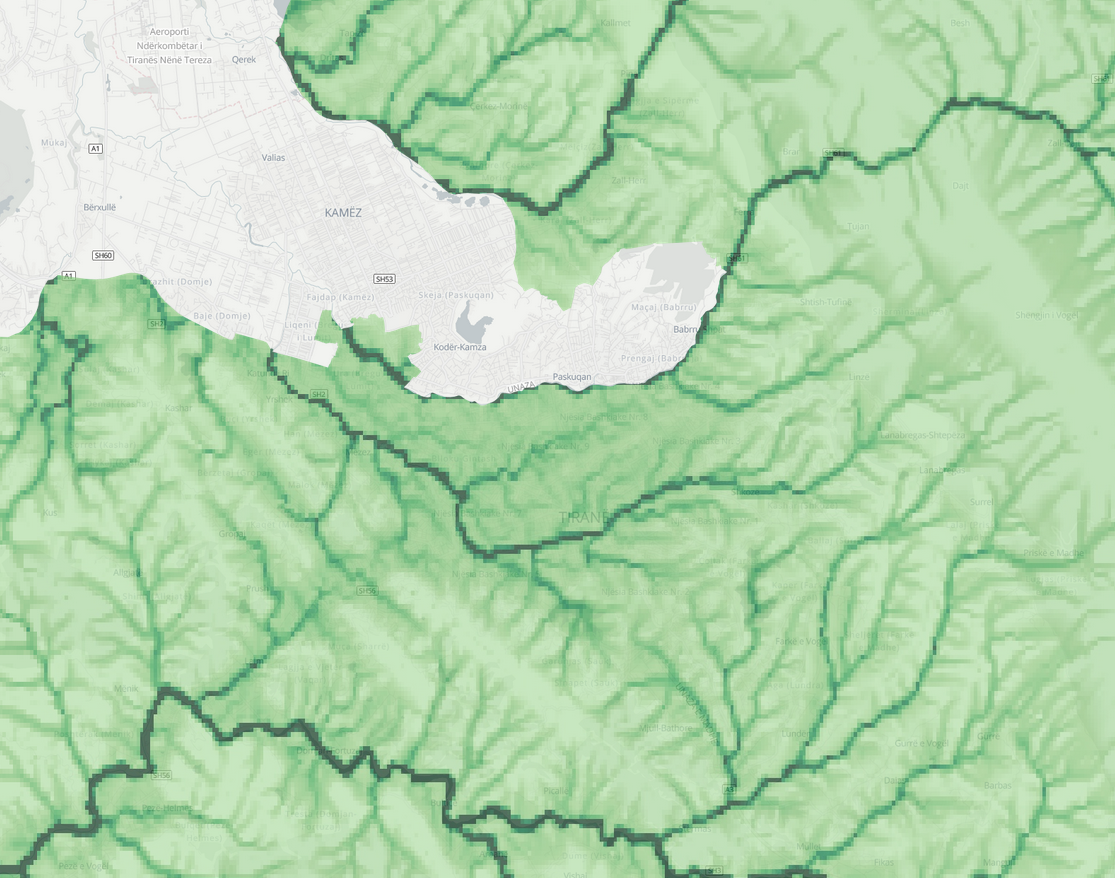
Available NowGeospatially derived compound topography is a term that refers to the combination of different types of topographic information, such as elevation, slope, and aspect, that are derived from digital elevation data. This information is often used to understand the physical characteristics of a landscape and the ways in which these characteristics can influence the distribution and behavior of plants, animals, and other organisms. It involves creating a grid of cells from the digital elevation data and then calculating various topographic features for each cell, such as slope, aspect, and elevation. These features are then combined in various ways to create a composite topographic map that provides a detailed and comprehensive picture of the landscape. Compound topography is often used in ecological and environmental studies to understand the impacts of topography on the distribution and movement of organisms, as well as to identify areas that may be vulnerable to erosion, landslides, or other natural hazards. It can also be used in land use planning and resource management to identify areas with specific topographic features that may be suitable for certain types of development or land use.
Resolution
90m
Cadence
Solo
Delivery
Hours
Price
€100
Coverage
Global
Data Range
2/11/2000 - 2/22/2000
EECU Seconds
11
GIZ
Compound Topography
World Protected Areas Map
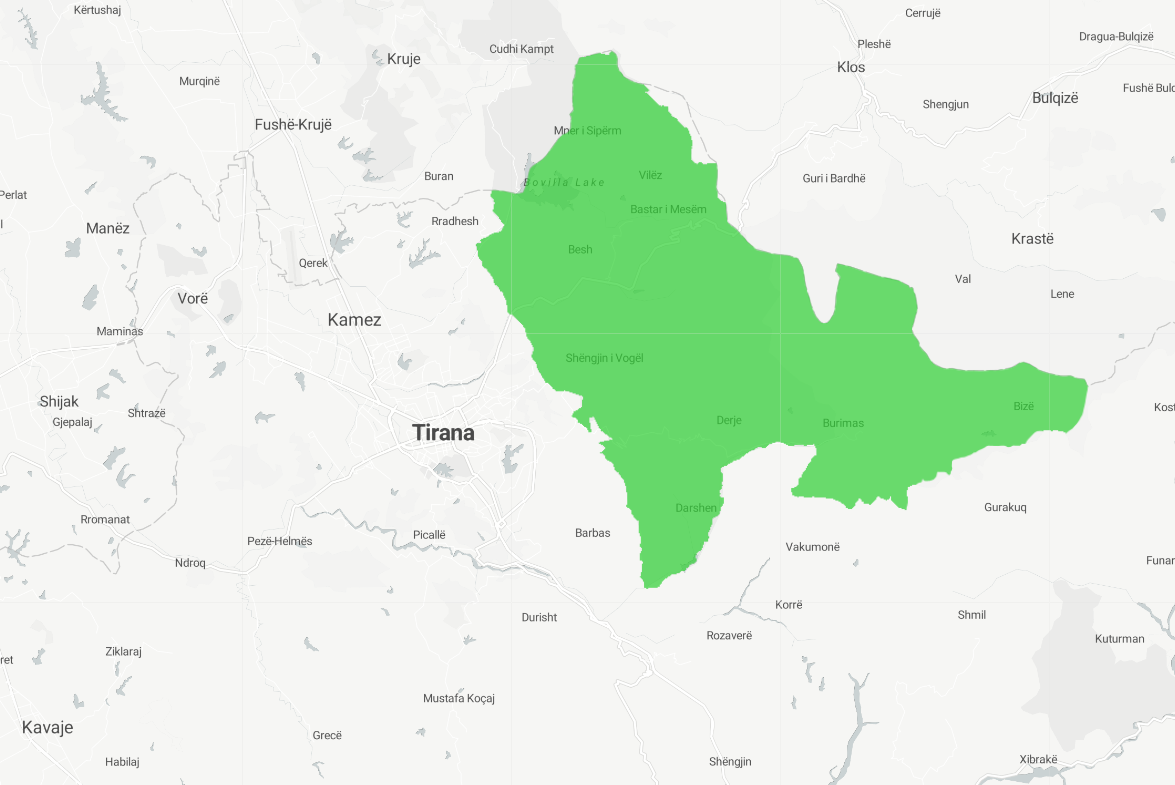
Available NowUNEP-derived World Protected Areas Map. The UNEP-derived World Protected Areas Map is a map created by the United Nations Environment Programme (UNEP) that shows the location and extent of protected areas around the world. Protected areas are areas of land or water that are designated for the conservation of natural resources, such as forests, wetlands, or wildlife habitats. The UNEP World Protected Areas Map is based on data obtained from various sources, including national and international conservation organizations, and provides a comprehensive overview of the global network of protected areas. This map can be useful for a variety of purposes, such as for monitoring and managing protected areas, for studying the distribution and characteristics of different types of ecosystems, or for supporting the planning and management of land and water resources.
Resolution
1m
Cadence
Monthly
Delivery
Hours
Price
€300
Coverage
Global
Data Range
7/30/2022 - 7/30/2022
EECU Seconds
20
GIZ
World Protected Areas Map
Wind Energy Potential
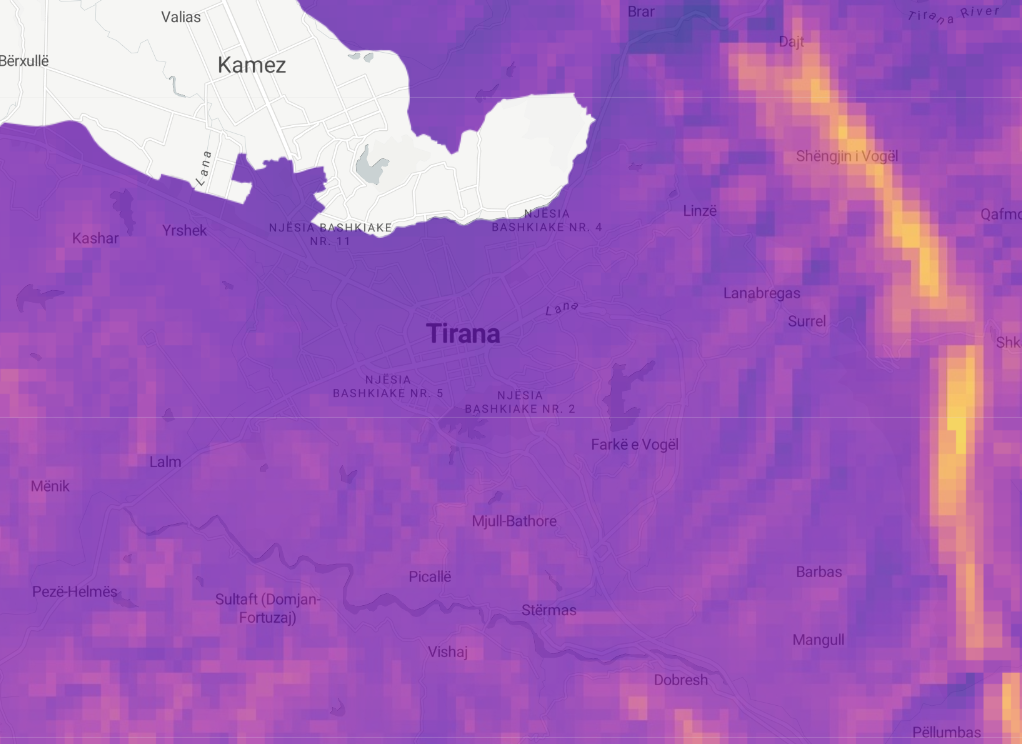
Available NowThe mean wind speed at the location for the 10 year period & The mean power density of the wind, which is related to the cube of the wind speed, and can provide additional information about the strength of the wind not found in the mean wind speed alone. A wind power potential map is a type of spatial dataset that shows the potential for wind energy production at different locations. This map is typically created using geographic information systems (GIS) technology, and is based on data about wind speed, wind direction, and other factors that affect the potential for wind energy generation. Wind power potential maps can provide valuable information for a wide range of purposes, such as for identifying locations that are suitable for wind energy development, for supporting the planning and management of renewable energy resources, or for understanding the potential for wind energy to contribute to a country's or region's energy mix.
Resolution
250m
Cadence
Solo
Delivery
Hours
Price
€100
Coverage
Global
Data Range
1/10/2022 - 1/10/2022
EECU Seconds
5
GIZ
Wind Energy Potential
Solar Energy Potential
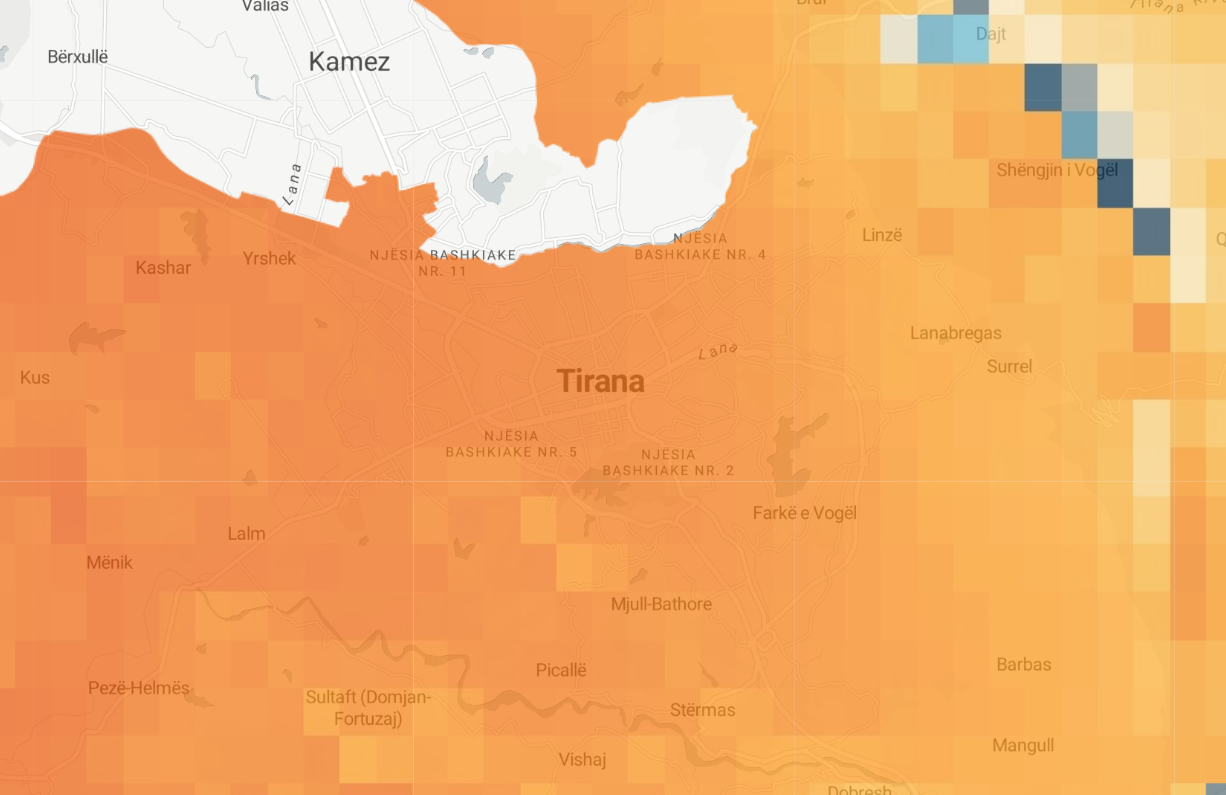
Available NowLongterm yearly average of daily totals of potential photovoltaic electricity production. A solar energy potential map is a type of spatial dataset that shows the potential for solar energy production at different locations. This map is typically created using geographic information systems (GIS) technology, and is based on data about solar radiation, cloud cover, and other factors that affect the potential for solar energy generation. Solar energy potential maps can provide valuable information for a wide range of purposes, such as for identifying locations that are suitable for solar energy development, for supporting the planning and management of renewable energy resources, or for understanding the potential for solar energy to contribute to a country's or region's energy mix.
Resolution
1000m
Cadence
Solo
Delivery
Hours
Price
€100
Coverage
Global
Data Range
1/6/2022 - 1/6/2022
EECU Seconds
29
GIZ
Solar Energy Potential
Data in Graph Format
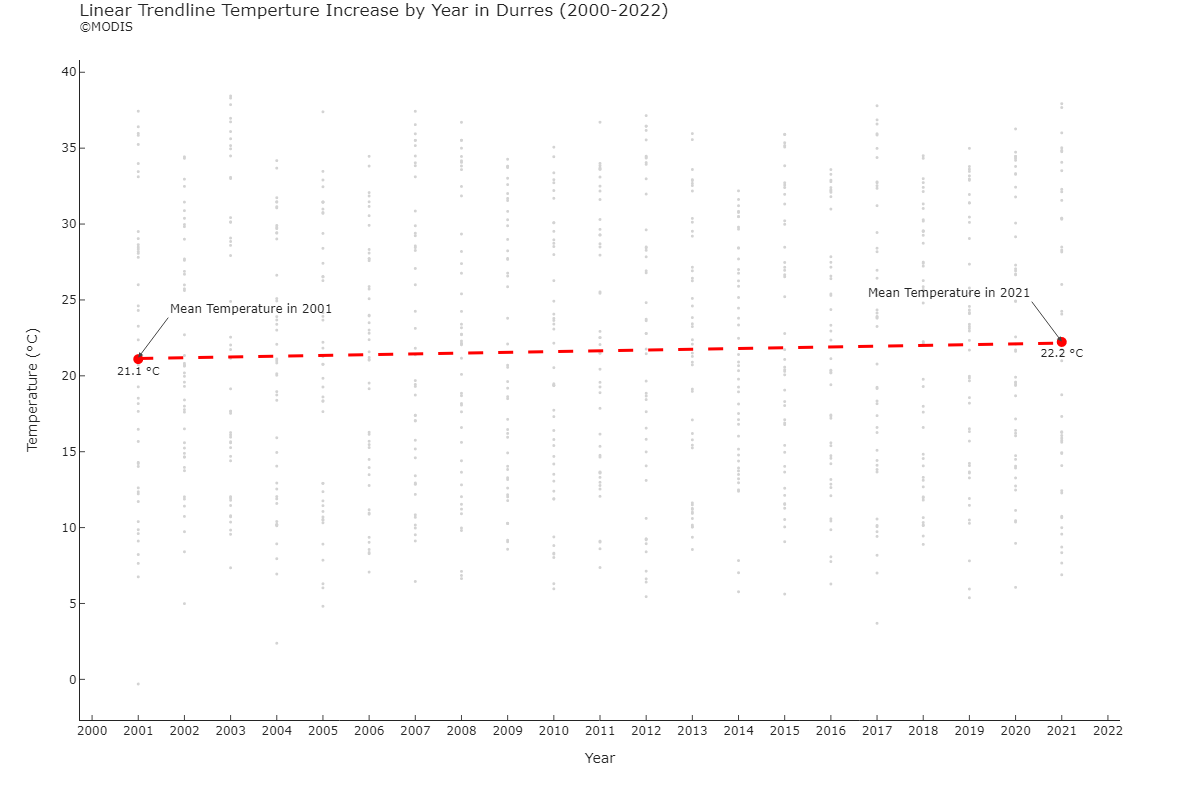
Available NowVarious datasets represented in a custom graph format
Resolution
1m
Cadence
Daily
Delivery
Hours
Price
n/a
Coverage
Global
Data Range
1/1/1970 - 12/31/2022
EECU Seconds
-
GIZ
n/a
Data in Report Format
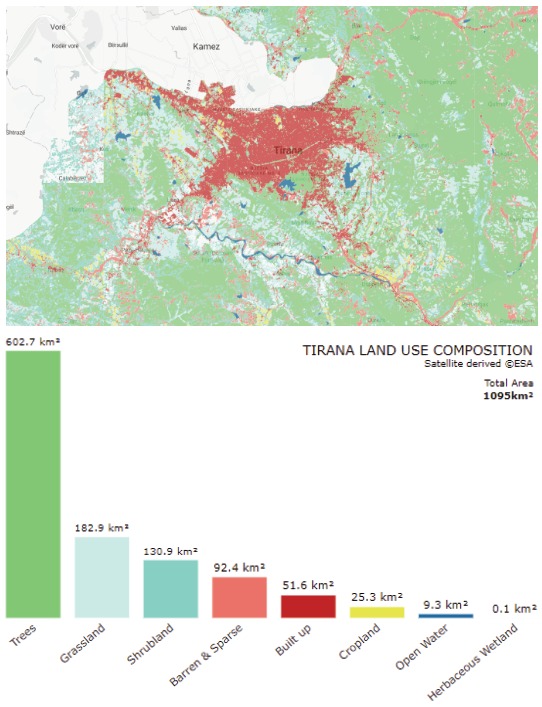
Available NowVarious datasets represented in a custom report format
Resolution
1m
Cadence
Daily
Delivery
Hours
Price
n/a
Coverage
Global
Data Range
1/1/1970 - 12/31/2022
EECU Seconds
-
GIZ
n/a
Sea Surface Temperature
Available SoonSea Surface Temperature measurement. Geospatially derived sea surface temperature is a measure of the temperature of the ocean's surface at a particular location, as determined using geographic information systems (GIS) technology. This information is typically obtained from satellite-based sensors, which can detect the thermal radiation emitted by the sea surface. Sea surface temperature is an important indicator of the health and productivity of marine ecosystems, and can provide valuable information for monitoring and managing ocean resources. It is also an important variable in climate modeling and can help to improve our understanding of the Earth's climate system.
Resolution
4638.3m
Cadence
Weekly
Delivery
Hours
Price
€100
Coverage
Global
Data Range
11/29/2021 - 7/26/2022
EECU Seconds
-
GIZ
n/a
Sea Surface Phytoplankton
Available SoonPhytoplankton (Chlorophyll-a) Ocean Concentration. Geospatially derived phytoplankton (chlorophyll-a) ocean concentration is a measure of the concentration of phytoplankton, a type of microscopic, photosynthetic organism, in the ocean at a particular location. Phytoplankton are an important component of the marine food web and play a key role in the global carbon cycle. The concentration of phytoplankton in the ocean can be determined using satellite-based sensors, which can detect the presence of chlorophyll-a, a pigment that is found in phytoplankton. This information is often represented as a map or spatial dataset using geographic information systems (GIS) technology, and can be used to monitor and manage ocean resources.
Resolution
4638.3m
Cadence
Weekly
Delivery
Hours
Price
€100
Coverage
Global
Data Range
11/29/2021 - 7/26/2022
EECU Seconds
-
GIZ
n/a
Historical Nightlight Activity
Available SoonSatellite-derived nightlight activity change from 1999 to 2014. Geospatially derived nightlight change is a type of spatial analysis that is used to evaluate changes in the intensity of artificial light at night over time. In this analysis, satellite-based images of nightlight radiance are used to create maps and spatial datasets that can be compared to identify changes in the intensity of light at different locations. This type of analysis can be useful for a variety of purposes, such as for monitoring the growth and development of urban areas, for studying the impacts of light pollution on the environment and wildlife, high-resolution estimates of urban economic development or for supporting the planning and management of energy resources.
Resolution
927.67m
Cadence
Monthly
Delivery
Hours
Price
€100
Coverage
Global
Data Range
1/1/1992 - 12/31/2013
EECU Seconds
-
GIZ
n/a
Leaf Area Index
Available SoonLeaf area index characterizes plant canopies: It is defined as the one-sided green leaf area per unit ground surface area in broadleaf canopies. Geospatially derived leaf area index (LAI) is a measure of the amount of leaf area per unit of ground area in a given location, as determined using geographic information systems (GIS) technology. Leaf area index is an important indicator of the productivity and health of vegetation, and can provide valuable information for monitoring and managing land resources. LAI can be determined using a variety of methods, including remote sensing techniques such as satellite imagery. This information is often represented as a map or spatial dataset, and can be used to understand the distribution and characteristics of vegetation within an area.
Resolution
4638.3m
Cadence
Weekly
Delivery
Hours
Price
€100
Coverage
Global
Data Range
11/29/2021 - 7/26/2022
EECU Seconds
-
GIZ
n/a
UV Aerosol Index
Available SoonA layer that visualizes UV-absorbing aerosols like dust and smoke. It is useful for tracking the evolution of episodic aerosol plumes from dust outbreaks, volcanic ash, and biomass burning. Geospatially derived ultraviolet (UV) aerosol index is a measure of the amount of aerosols, which are tiny particles suspended in the atmosphere, in a given location. This index is typically determined using satellite-based sensors, which can detect the amount of UV radiation that is absorbed or scattered by aerosols in the atmosphere. The UV aerosol index is an important indicator of air quality, and can provide valuable information for monitoring and managing air pollution. This information is often represented as a map or spatial dataset using geographic information systems (GIS) technology, and can be used to understand the distribution and characteristics of aerosols within an area.
Resolution
1113.2m
Cadence
Weekly
Delivery
Hours
Price
€100
Coverage
Global
Data Range
7/10/2018 - 7/26/2022
EECU Seconds
-
GIZ
n/a
Carbon Monoxide (CO) Concentration
Available SoonThis dataset provides near real-time high-resolution imagery of CO concentrations. Geospatially derived carbon monoxide (CO) concentration is a measure of the amount of carbon monoxide, a toxic gas, in the atmosphere at a given location. This concentration is typically determined using satellite-based sensors, which can detect the presence of CO in the atmosphere. Carbon monoxide is a harmful air pollutant that can have negative impacts on human health and the environment. The concentration of CO in the atmosphere can be represented as a map or spatial dataset using geographic information systems (GIS) technology, and can be used to monitor and manage air pollution. Main sources of CO are combustion of fossil fuels, biomass burning, and atmospheric oxidation of methane and other hydrocarbons. Whereas fossil fuel combustion is the main source of CO at northern mid-latitudes, the oxidation of isoprene and biomass burning play an important role in the tropics.
Resolution
1113.2m
Cadence
Weekly
Delivery
Hours
Price
€100
Coverage
Global
Data Range
11/22/2018 - 7/26/2022
EECU Seconds
-
GIZ
n/a
Atmospheric Formaldehyde (HCHO) Concentration
Available SoonThis dataset provides near real-time high-resolution imagery of atmospheric formaldehyde (HCHO) concentrations. Formaldehyde is an intermediate gas in almost all oxidation chains of non-methane volatile organic compounds (NMVOC), leading eventually to CO2. Geospatially derived atmospheric formaldehyde (HCHO) concentration is a measure of the amount of formaldehyde, a toxic gas, in the atmosphere at a given location. This concentration is typically determined using satellite-based sensors, which can detect the presence of HCHO in the atmosphere. Formaldehyde is a harmful air pollutant that can have negative impacts on human health and the environment. The concentration of HCHO in the atmosphere can be represented as a map or spatial dataset using geographic information systems (GIS) technology, and can be used to monitor and manage air pollution.
Resolution
1113.2m
Cadence
Weekly
Delivery
Hours
Price
€100
Coverage
Global
Data Range
10/2/2018 - 7/26/2022
EECU Seconds
-
GIZ
n/a
Nitrogen Dioxide (NO2) Concentration
Available SoonThis dataset provides near real-time high-resolution imagery of NO2 concentrations. They enter the atmosphere as a result of anthropogenic activities (notably fossil fuel combustion and biomass burning) and natural processes (wildfires, lightning, and microbiological processes in soils). Geospatially derived nitrogen dioxide (NO2) concentration is a measure of the amount of nitrogen dioxide, a toxic gas, in the atmosphere at a given location. This concentration is typically determined using satellite-based sensors, which can detect the presence of NO2 in the atmosphere. Nitrogen dioxide is a harmful air pollutant that can have negative impacts on human health and the environment. The concentration of NO2 in the atmosphere can be represented as a map or spatial dataset using geographic information systems (GIS) technology, and can be used to monitor and manage air pollution.
Resolution
1113.2m
Cadence
Weekly
Delivery
Hours
Price
€100
Coverage
Global
Data Range
7/10/2018 - 7/26/2022
EECU Seconds
-
GIZ
n/a
Ozone (O3) Concentration
Available SoonThis dataset provides near-real-time high-resolution imagery of total column ozone concentrations. In the stratosphere, the ozone layer shields the biosphere from dangerous solar ultraviolet radiation. In the troposphere, it acts as an efficient cleansing agent, but at high concentration it also becomes harmful to the health of humans, animals, and vegetation. Ozone is also an important greenhouse-gas contributor to ongoing climate change. Geospatially derived ozone (O3) concentration is a measure of the amount of ozone, a toxic gas, in the atmosphere at a given location. This concentration is typically determined using satellite-based sensors, which can detect the presence of O3 in the atmosphere. Ozone is a harmful air pollutant that can have negative impacts on human health and the environment. The concentration of O3 in the atmosphere can be represented as a map or spatial dataset using geographic information systems (GIS) technology, and can be used to monitor and manage air pollution.
Resolution
1113.2m
Cadence
Weekly
Delivery
Hours
Price
€100
Coverage
Global
Data Range
7/10/2018 - 7/26/2022
EECU Seconds
-
GIZ
n/a
Sulfur Dioxide (SO2) Concentration
Available SoonThis dataset provides near real-time high-resolution imagery of atmospheric sulfur dioxide (SO2) concentrations. Sulphur dioxide (SO2) enters the Earth’s atmosphere through both natural and anthropogenic processes. It plays a role in chemistry on a local and global scale and its impact ranges from short-term pollution to effects on climate. Only about 30% of the emitted SO2 comes from natural sources; the majority is of anthropogenic origin. SO2 emissions adversely affect human health and air quality. Geospatially derived sulfur dioxide (SO2) concentration is a measure of the amount of sulfur dioxide, a toxic gas, in the atmosphere at a given location. This concentration is typically determined using satellite-based sensors, which can detect the presence of SO2 in the atmosphere. Sulfur dioxide is a harmful air pollutant that can have negative impacts on human health and the environment. The concentration of SO2 in the atmosphere can be represented as a map or spatial dataset using geographic information systems (GIS) technology, and can be used to monitor and manage air pollution.
Resolution
1113.2m
Cadence
Weekly
Delivery
Hours
Price
€100
Coverage
Global
Data Range
7/10/2018 - 7/26/2022
EECU Seconds
-
GIZ
n/a
Methane (CH4) Concentration
Available SoonThis dataset provides offline high-resolution imagery of methane concentrations. Methane (CH4) is, after carbon dioxide (CO2), the most important contributor to the anthropogenically enhanced greenhouse effect. Roughly three-quarters of methane emissions are anthropogenic. Geospatially derived methane (CH4) concentration is a measure of the amount of methane, a potent greenhouse gas, in the atmosphere at a given location. This concentration is typically determined using satellite-based sensors, which can detect the presence of CH4 in the atmosphere. Methane is a major contributor to global warming and can have negative impacts on the environment. The concentration of CH4 in the atmosphere can be represented as a map or spatial dataset using geographic information systems (GIS) technology, and can be used to monitor and manage greenhouse gas emissions.
Resolution
1113.2m
Cadence
Weekly
Delivery
Hours
Price
€100
Coverage
Global
Data Range
8/2/2019 - 7/26/2022
EECU Seconds
-
GIZ
n/a
Historic Land Surface Temperature
Available SoonHistorical satellite-derived quarterly average land surface temperature from 1981 to three months from real-time. Geospatially derived land surface temperature is a measure of the temperature of the Earth's surface at a particular location, as determined using geographic information systems (GIS) technology. This information is typically obtained from satellite-based sensors, which can detect the thermal radiation emitted by the land surface. Land surface temperature is an important indicator of the health and productivity of an ecosystem, and can provide valuable information for monitoring and managing land resources. It is also an important variable in climate modeling and can help to improve our understanding of the Earth's climate system.
Resolution
11132m
Cadence
Quarterly
Delivery
Hours
Price
€300
Coverage
Global
Data Range
1/1/1981 - 4/29/2022
EECU Seconds
-
GIZ
n/a
Multiple Biodiversity Index
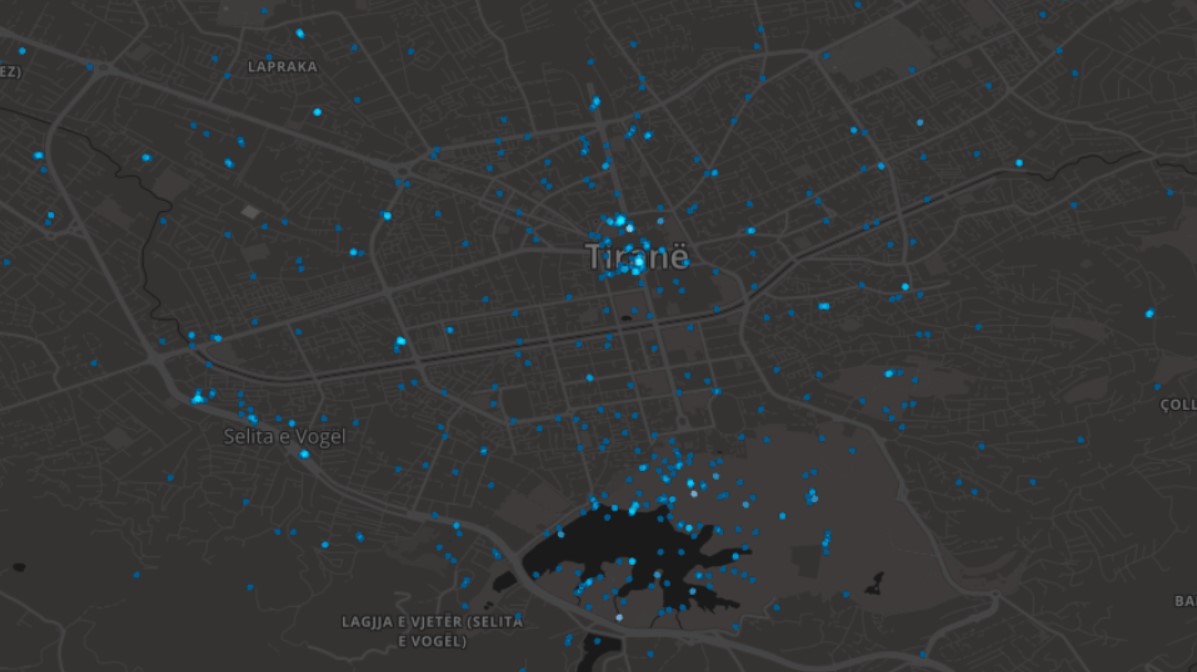
Available SoonThis dataset provides an index of biodiversity, sourced from crowdsourced and remote-sensed data. A multiple biodiversity index is a measure of the overall health and diversity of an ecosystem, based on a combination of different indicators of biodiversity. These indicators may include the number and variety of species present in the ecosystem, the distribution of species across different habitats, and the health and productivity of those species. Multiple biodiversity indices are often used by researchers, governments, and organizations to monitor and manage ecosystems, and to understand the impacts of human activities on biodiversity. These indices can provide valuable information for supporting decision making and planning, and for identifying areas that may require additional conservation efforts.
Resolution
1m
Cadence
Daily
Delivery
Hours
Price
€100
Coverage
Global
Data Range
1/1/1600 - 7/26/2022
EECU Seconds
-
GIZ
n/a
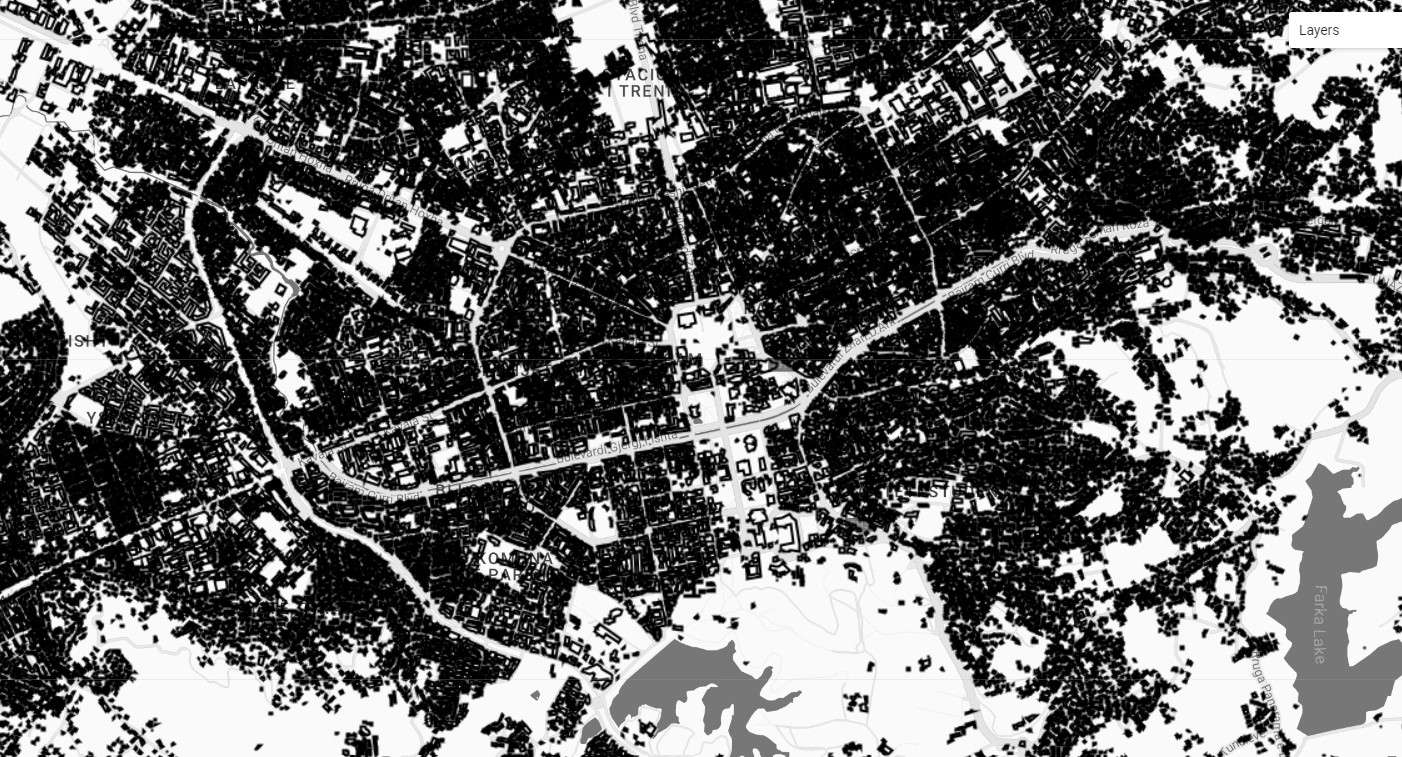
Global Building Footprints
Available SoonA comprehensive dataset of rough machine-learning derived outlines of all buildings in the world in 2021. A geospatially derived global building footprints map is a type of spatial dataset that represents the location and extent of buildings, such as houses, apartments, and other structures, across the globe. This dataset is typically created using geographic information systems (GIS) technology, and is based on data obtained from satellite imagery. The global building footprints map can provide valuable information for a wide range of purposes, such as for understanding the patterns and dynamics of urbanization, for studying the impacts of buildings on the environment and local communities, or for supporting the planning and management of land resources.
Resolution
1m
Cadence
Solo
Delivery
Hours
Price
€100
Coverage
Global
Data Range
1/1/2014 - 1/1/2021
EECU Seconds
-
GIZ
n/a